MOSAIC: Towards a Universal Latent Space for Computational Pathology Foundation Models

Anonymous Submission
Under Review at WACV
Code Results Methods
12
Patch Encoders
6
Slide Encoders
13
Downstream Tasks
4,331
Total Slides (TCGA & CPTAC)
47.5M+
Extracted Patches
3
Organs (Breast, Lung, Colon)
229
Property Tests
20x, 10x, 5x
Magnifications

The Key Idea

Do independently trained pathology foundation models learn the same thing?

Central Hypothesis: Independently trained pathology foundation models learn different coordinate systems over a shared underlying morphological manifold.

If that holds, representations should be alignable, semantic neighbourhoods should survive alignment, features should transfer between models, and a downstream classifier should be able to live inside one shared space.

Method
Benchmark 18 state-of-the-art vision and vision-language pathology encoders across 4,331 TCGA and CPTAC whole-slide images, evaluating similarity, representation alignment, and downstream transferability.
RQ1 · Similarity

How similar are the representation spaces of 18 pathology encoders measured by 7 similarity metrics?

RQ2 · Architecture vs Objective

Does the pretraining objective (Vision SSL vs Vision–Language) drive latent geometry more than architecture?

RQ3 · Alignment

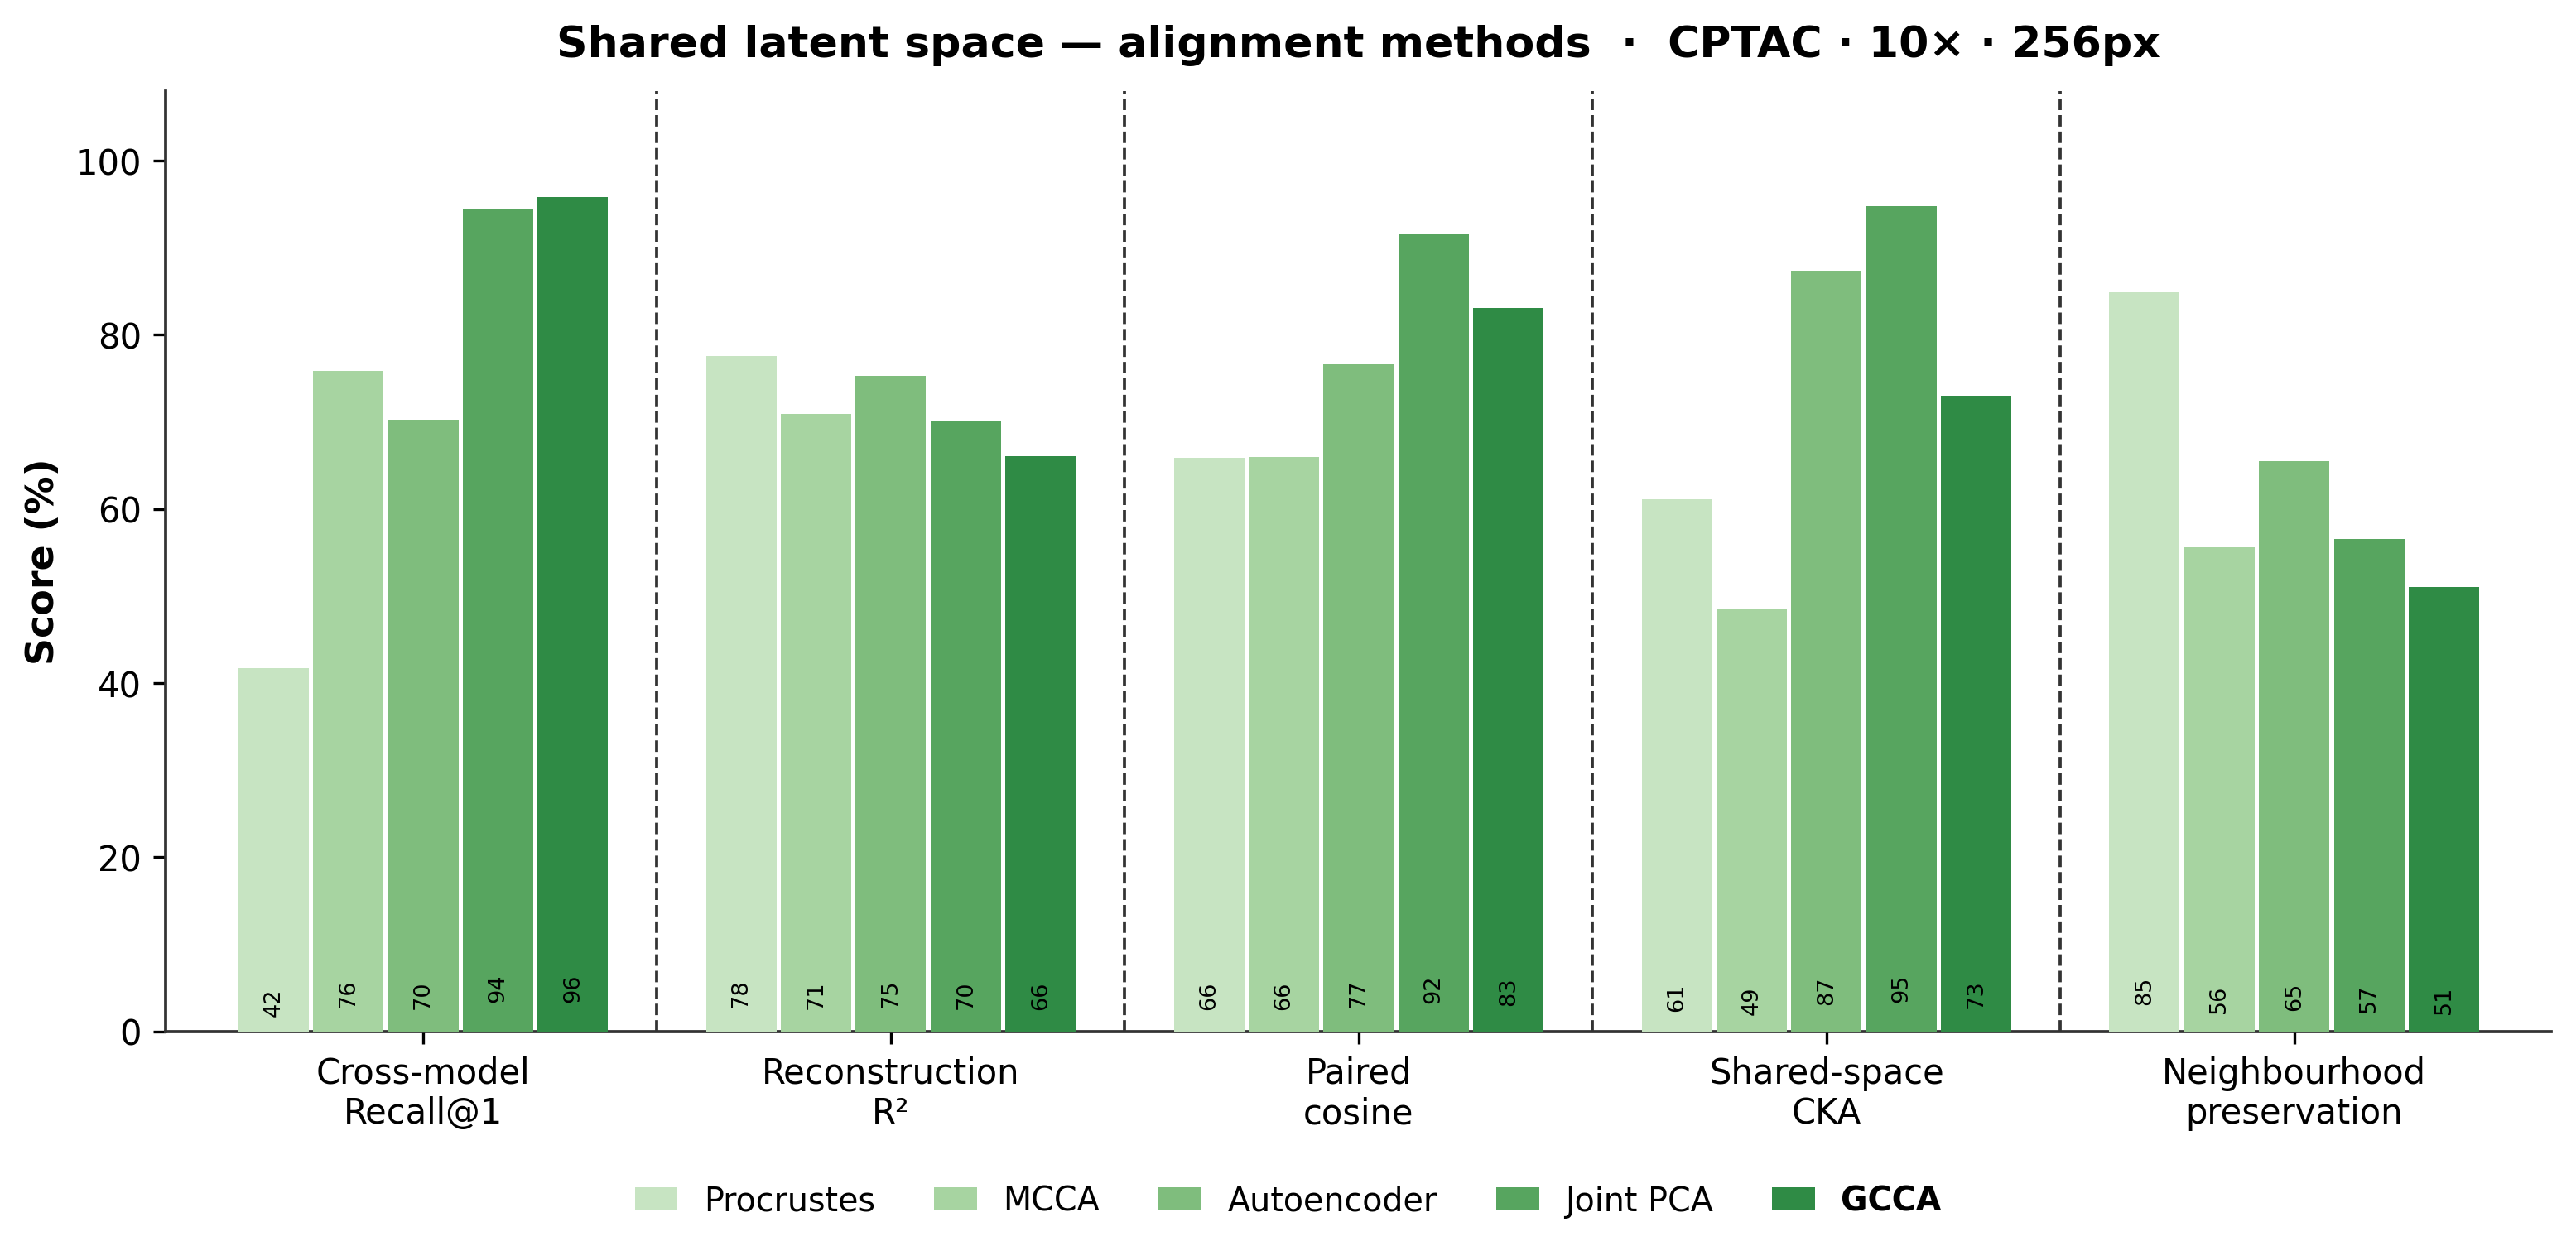
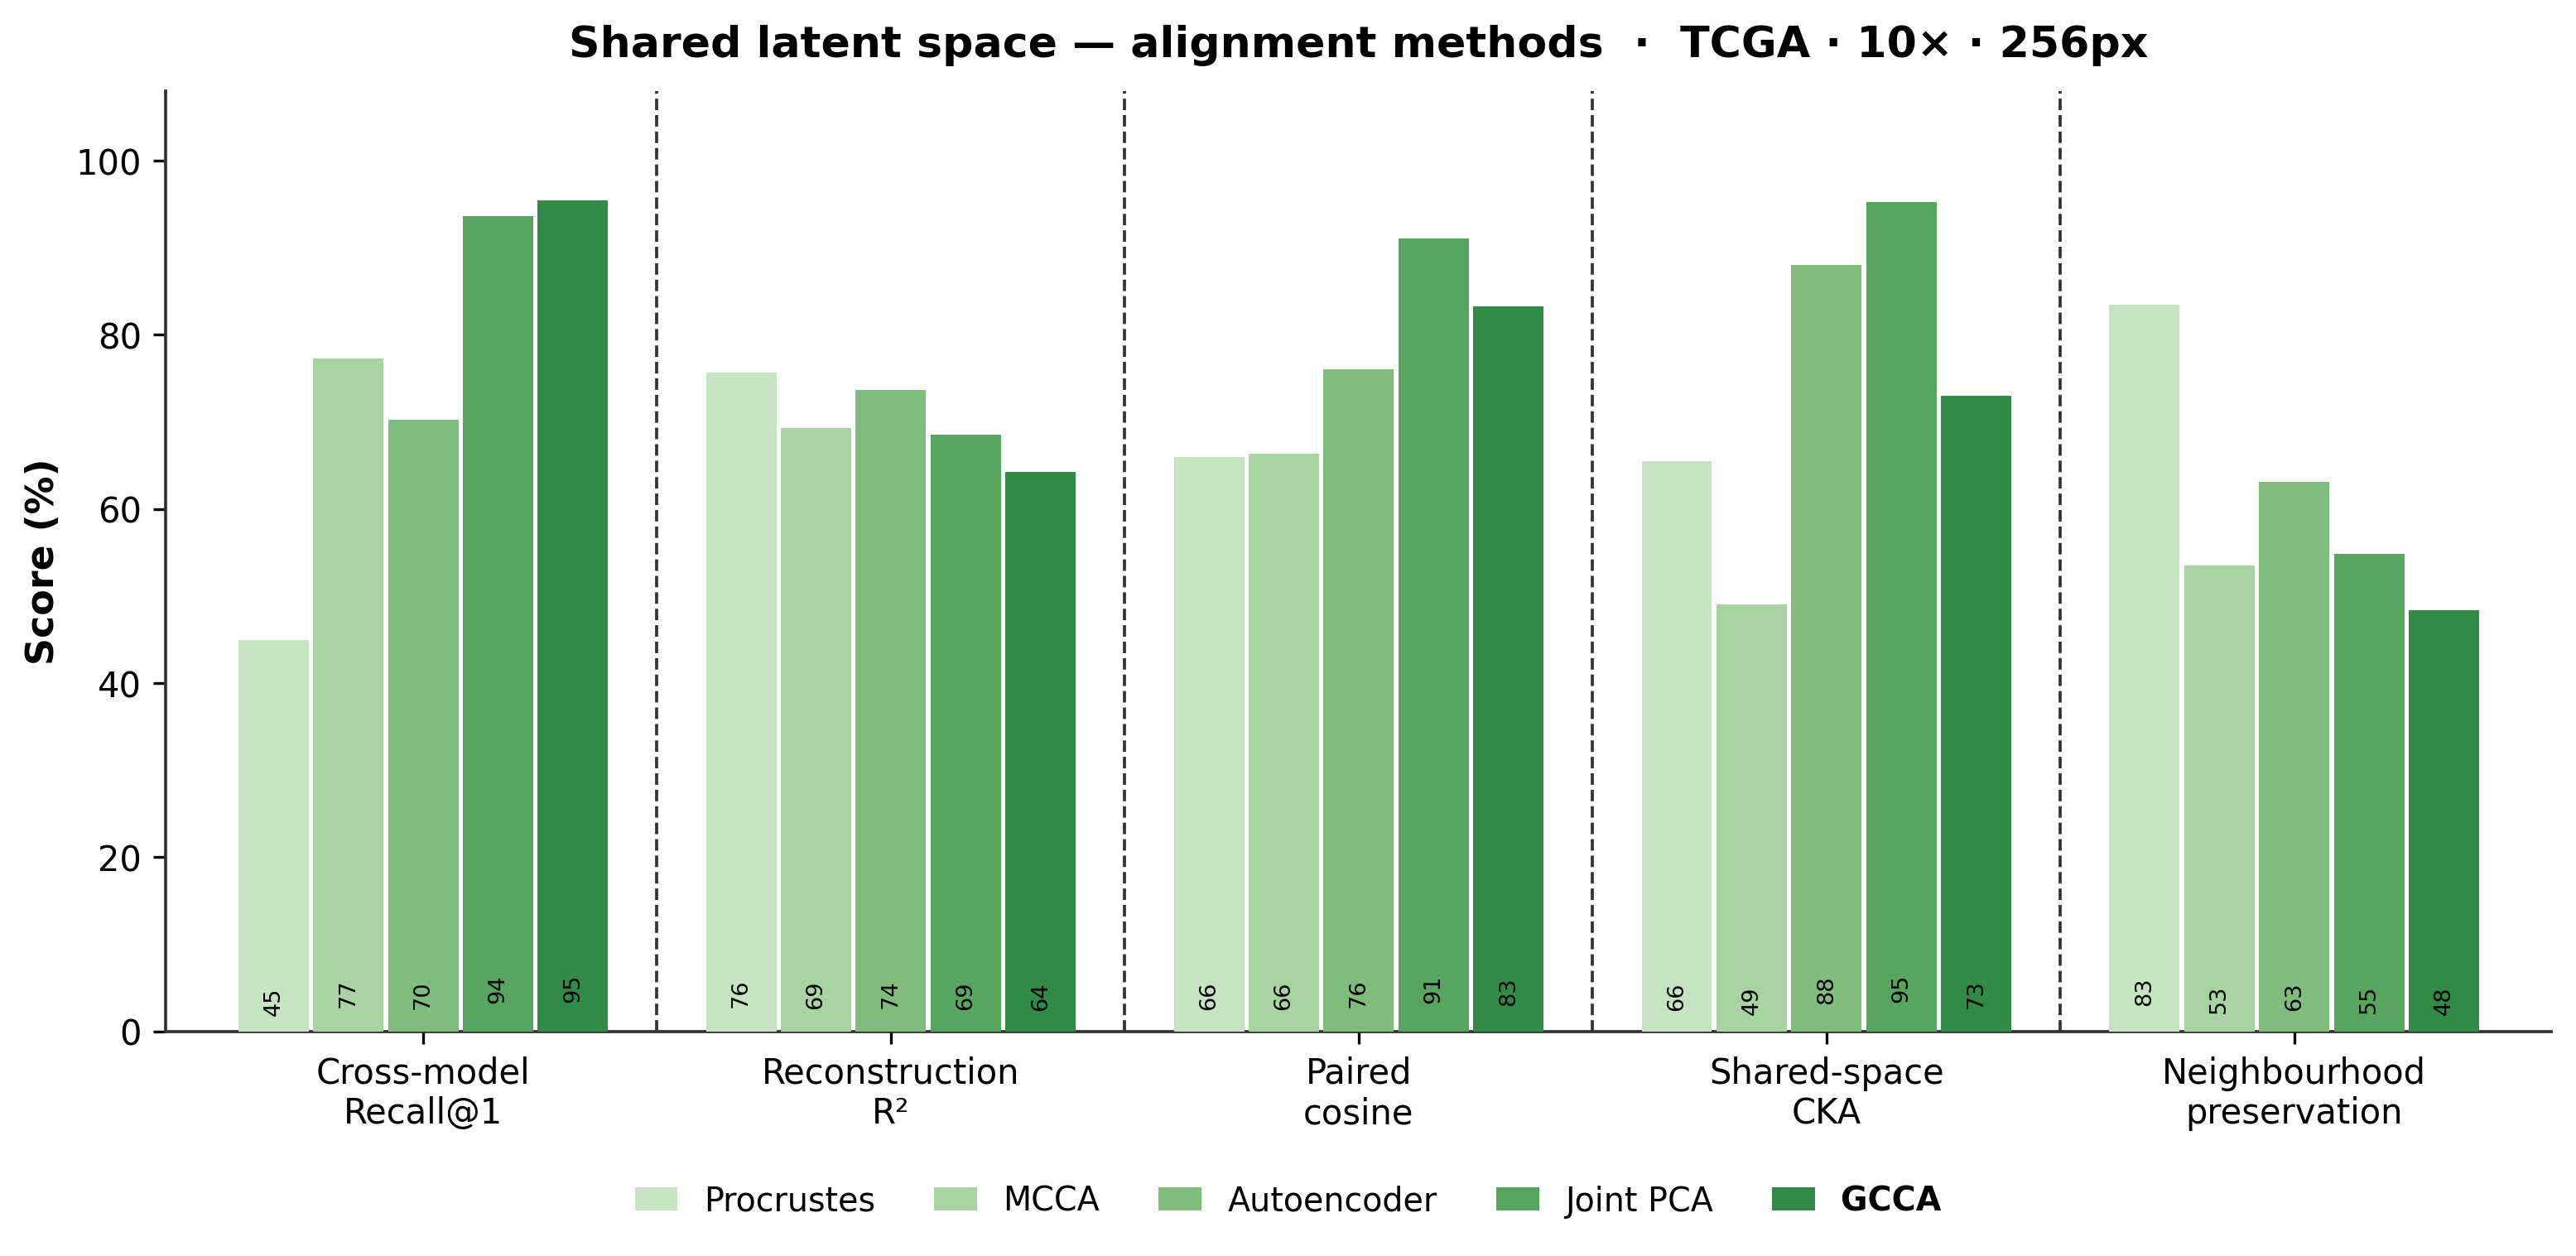
Can the evaluated alignment methods align several models into one shared latent space?

RQ4 · Downstream Impact

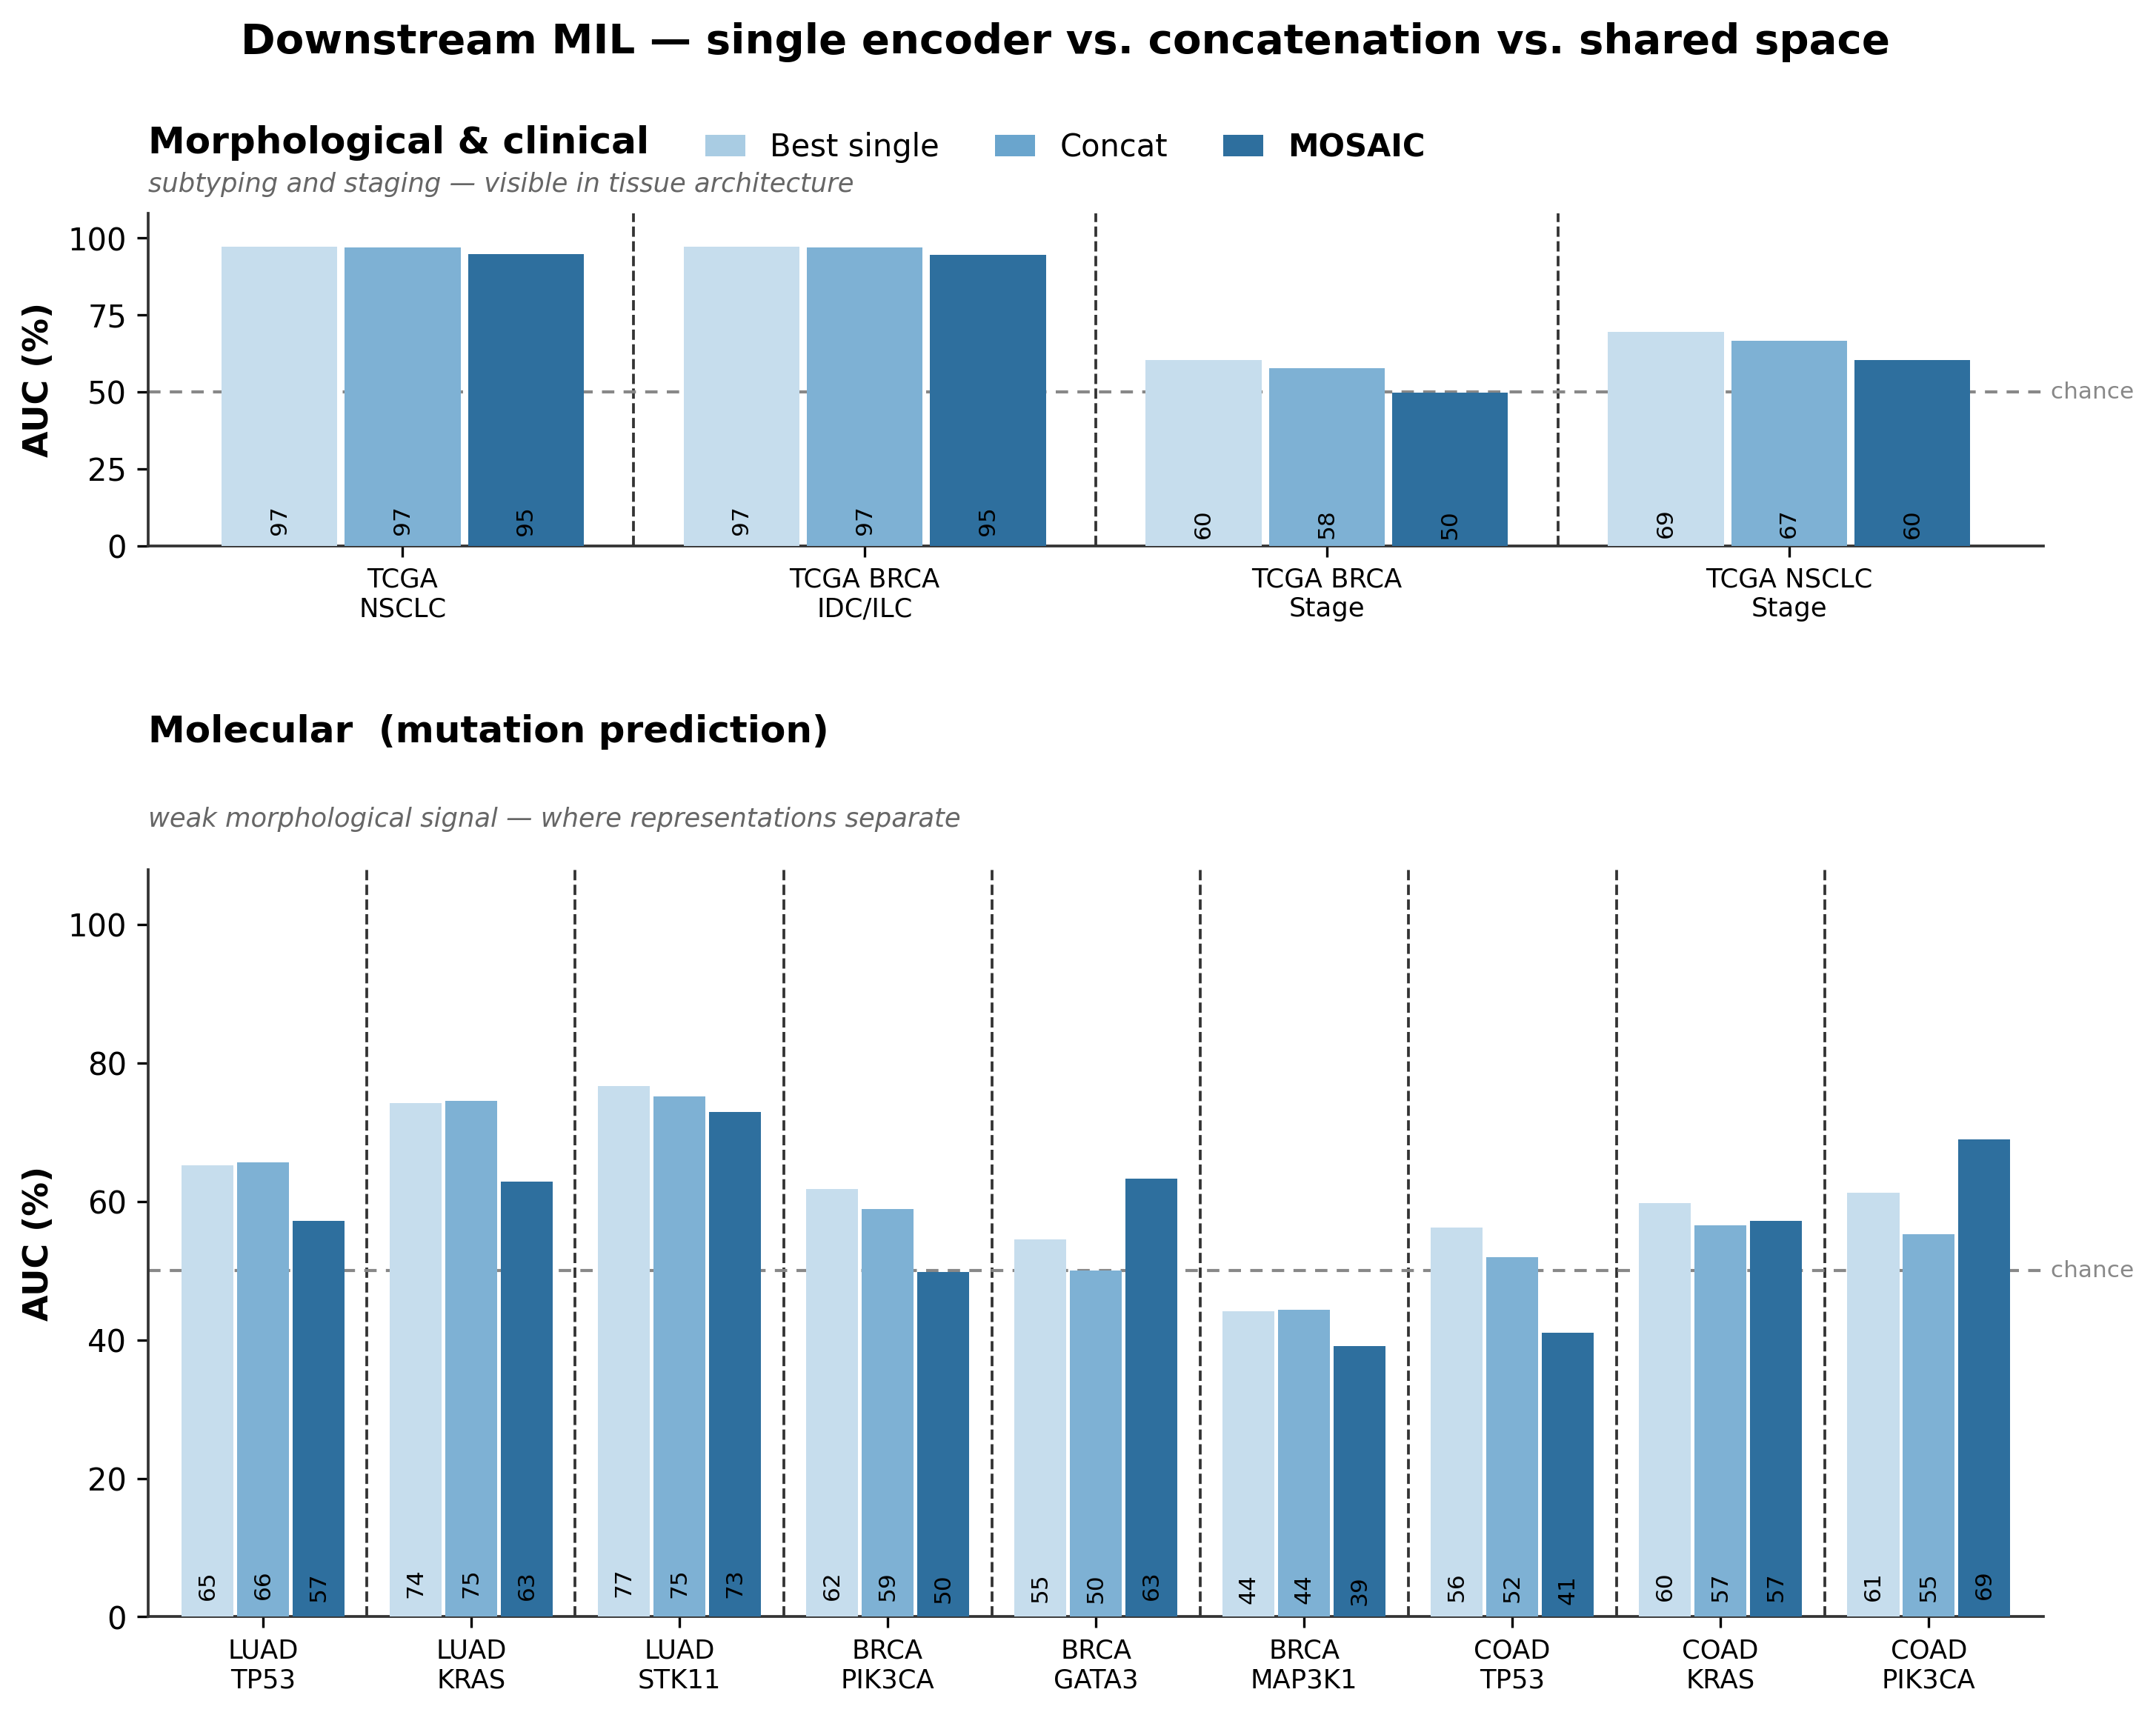
Does the aligned space improve downstream MIL classification on 13 morphological, clinical, and molecular tasks?

RQ5 · Cross-model Transfer

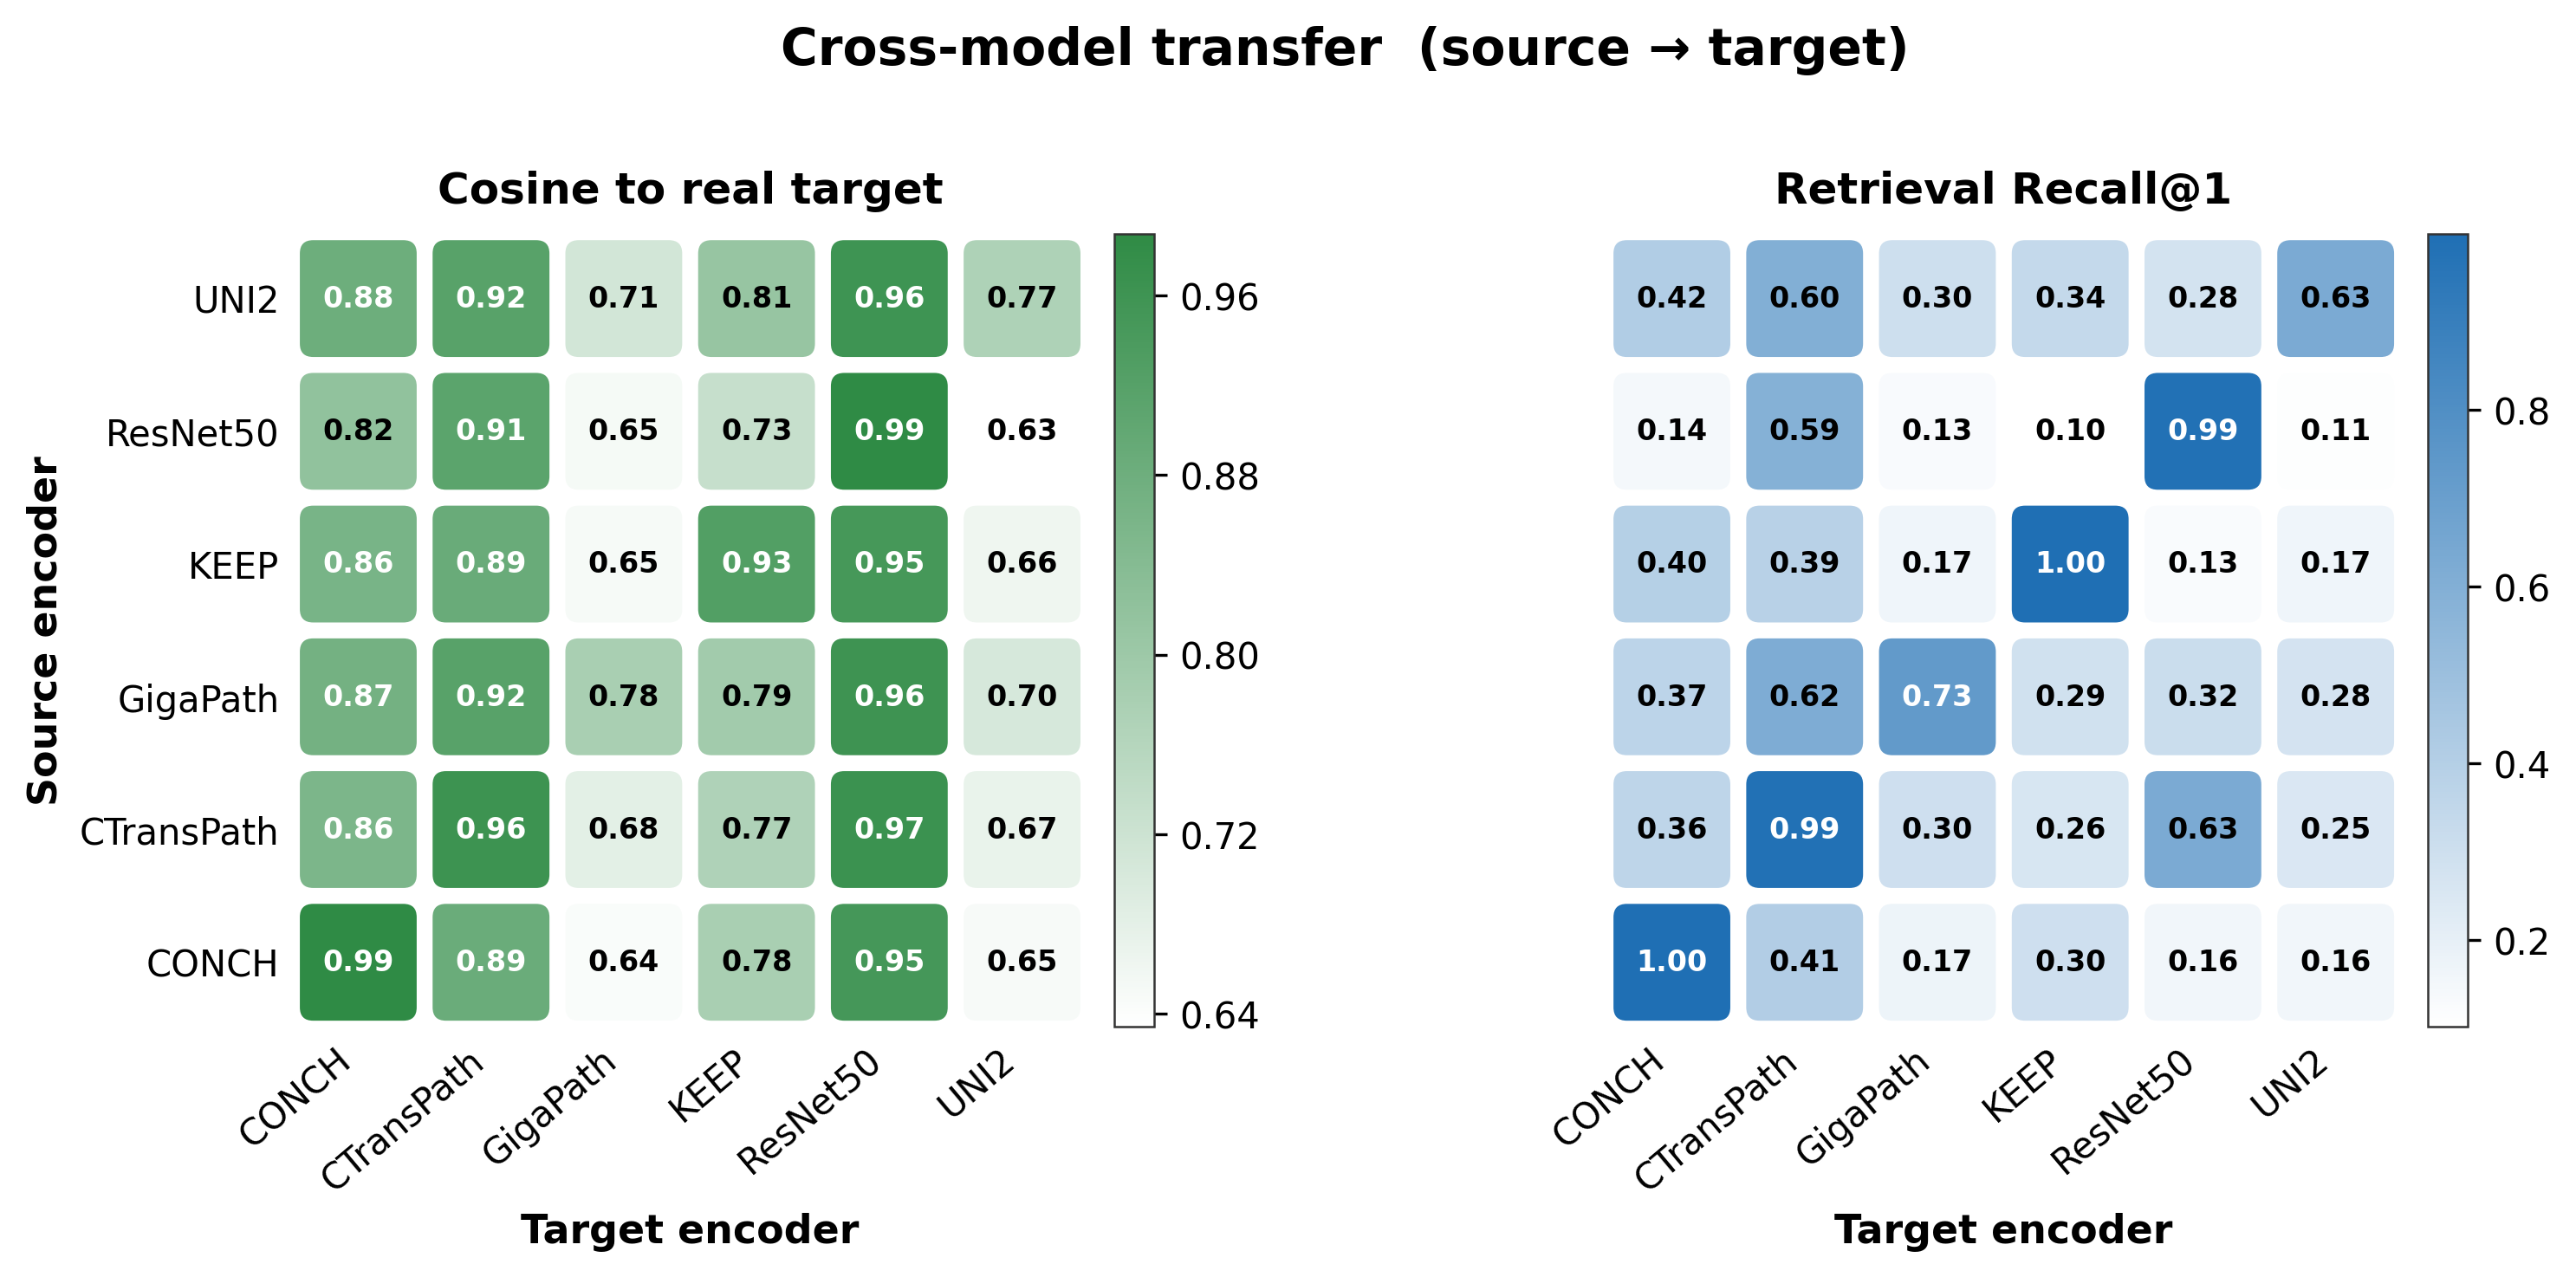
Does a classifier trained on one encoder generalise to another encoder's features through the shared space?

MOSAIC-Bench

A rigorous benchmark comprising 4,331 whole-slide images and 13 downstream tasks across 3 organ types.

Cohorts (4,331 Slides Total)

TCGA

2,169 Slides
Breast (BRCA) 1,126
Lung (LUAD / LUSC) 1,043

CPTAC

2,162 Slides
Breast (BRCA) 654
Lung (LUAD) 1,139
Colon (COAD) 369

13 Downstream Tasks

Morphological / Clinical

HIGH-LEVEL

Subtyping and staging tasks that are visually apparent in tissue architecture.

  • NSCLC subtyping (LUAD vs LUSC)
  • Breast IDC vs ILC
  • Breast staging
  • Lung staging

Molecular (Mutations)

LOW-LEVEL
  • LUAD: TP53, KRAS, STK11
  • BRCA: PIK3CA, GATA3, MAP3K1
  • COAD: TP53, KRAS, PIK3CA

The 18 Foundation Models

A diverse landscape of 12 patch-level encoders and 6 slide-level encoders, covering Vision SSL, Vision–Language, and a supervised control.

Resource links point to primary author releases. An em dash means no official resource is available; third-party model mirrors are intentionally omitted.

12 Patch Encoders

Patch-level representation registry

7 Vision SSL 4 Vision–Language 1 Supervised Control
Twelve patch encoders with embedding width, visual backbone, pretraining objective, family, paper, code, and model links.
Encoder Embedding Visual Backbone Pretraining Objective Family Paper GitHub Hugging Face
UNI2-h 1,536-D ViT-H/14 + Register Tokens DINOv2 Vision SSL
Prov-GigaPath 1,536-D ViT-g/14 DINOv2 Vision SSL
Virchow 2,560-D ViT-H/14 DINOv2 Vision SSL
Virchow2 2,560-D ViT-H/14 DINOv2 + Pathology-Specific Augmentations Vision SSL
H-optimus-0 1,536-D ViT-g/14 DINOv2 Vision SSL —
GPFM 1,024-D ViT-L/14 Multi-Teacher Expert Distillation Vision SSL
CTransPath 768-D CNN + Swin-T Hybrid SRCL Contrastive Learning Vision SSL —
CONCH 512-D ViT-B/16 + Text Encoder CoCa: Contrastive + Captioning Vision–Language
CONCH v1.5 768-D ViT-L/16, 448px Vision–Language Pretraining (TITAN Patch Encoder) Vision–Language — —
KEEP 768-D ViT-L/16 Knowledge-Enhanced Vision–Language Pretraining Vision–Language
MUSK 1,024-D BEiT-3 Multimodal Transformer, 384px Masked Modeling + Vision–Language Alignment Vision–Language
ResNet50 1,024-D ResNet-50 through Layer 3 ImageNet-1K Supervised Classification Control —

6 Slide Encoders

Six slide encoders with embedding width, source grid, paper, code, and model links.
Encoder Embedding Built on Grid Paper GitHub Hugging Face
CHIEF 768-D 10x / 256px —
Madeleine 512-D 10x / 256px
PRISM 1,280-D 20x / 224px —
GigaPath-slide 768-D 20x / 256px
TITAN 768-D 20x / 512px
Feather 512-D 20x / 512px

Theory & Methods

An overview of the 7 similarity metrics and 5 alignment methods used to compare and align cross-encoder representations.

7 Similarity Metrics

Name What it measures
Linear CKA Linear correlation between representation spaces independent of orthogonal transformations.
Kernel CKA Non-linear correlation capturing higher-order interactions using RBF kernels.
SVCCA Singular Value Canonical Correlation Analysis (PCA followed by CCA).
PWCCA Projection Weighted CCA (weights CCA directions by variance explained).
Procrustes Distance after optimal orthogonal alignment.
Cosine RSA Representational Similarity Analysis using Cosine distance between samples.
Distance Correlation Dependence measure robust to non-linear associations.

5 Alignment Methods

Name What it aligns
GCCA Generalized Canonical Correlation Analysis aligns multiple spaces to a shared latent representation.
MCCA Multi-set CCA extends standard CCA to maximize pairwise correlations among multiple representation sets.
Generalized Procrustes Finds optimal orthogonal transformations to align multiple spaces to a central mean representation.
Joint PCA (jPCA) Computes a shared low-rank subspace across concatenated features.
Shared Autoencoder Learns non-linear mappings into a shared bottleneck capable of reconstructing all modalities.

Evidence browser

Results by research question

Explore the released findings without scrolling through a wall of figures. Select a research question, then switch cohort, patch grid, or evaluation view. Every panel is regenerated from the released tables by scripts/render_figures.py.

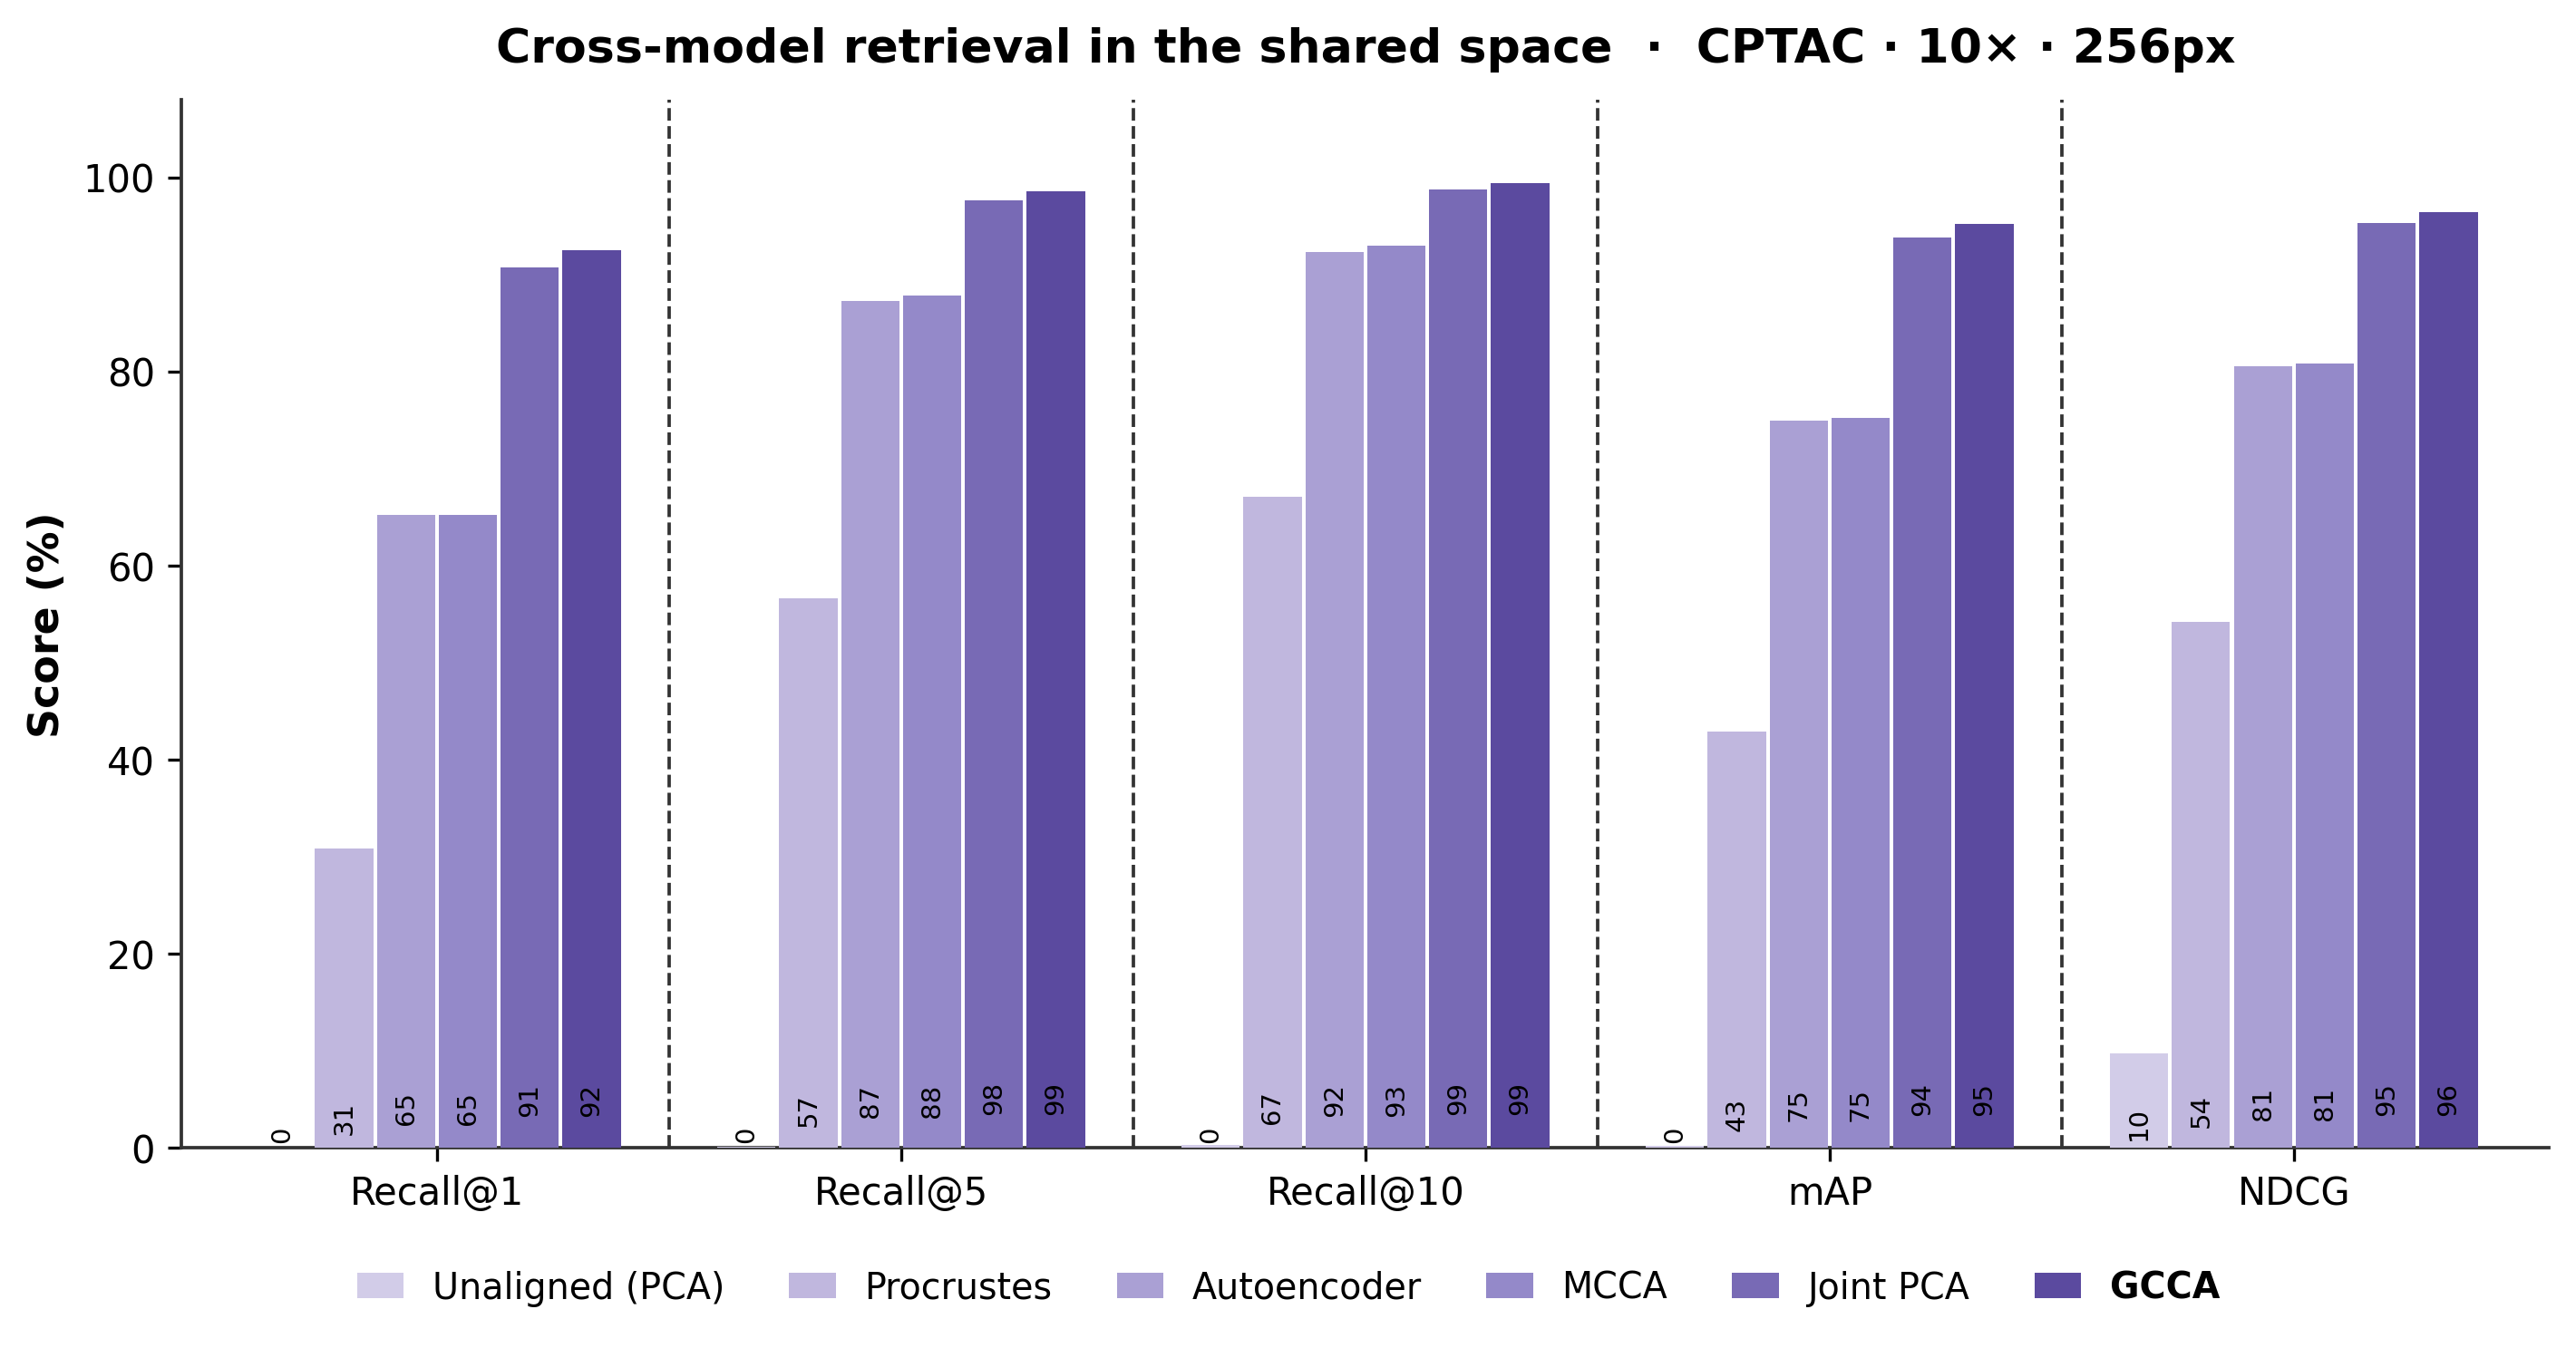
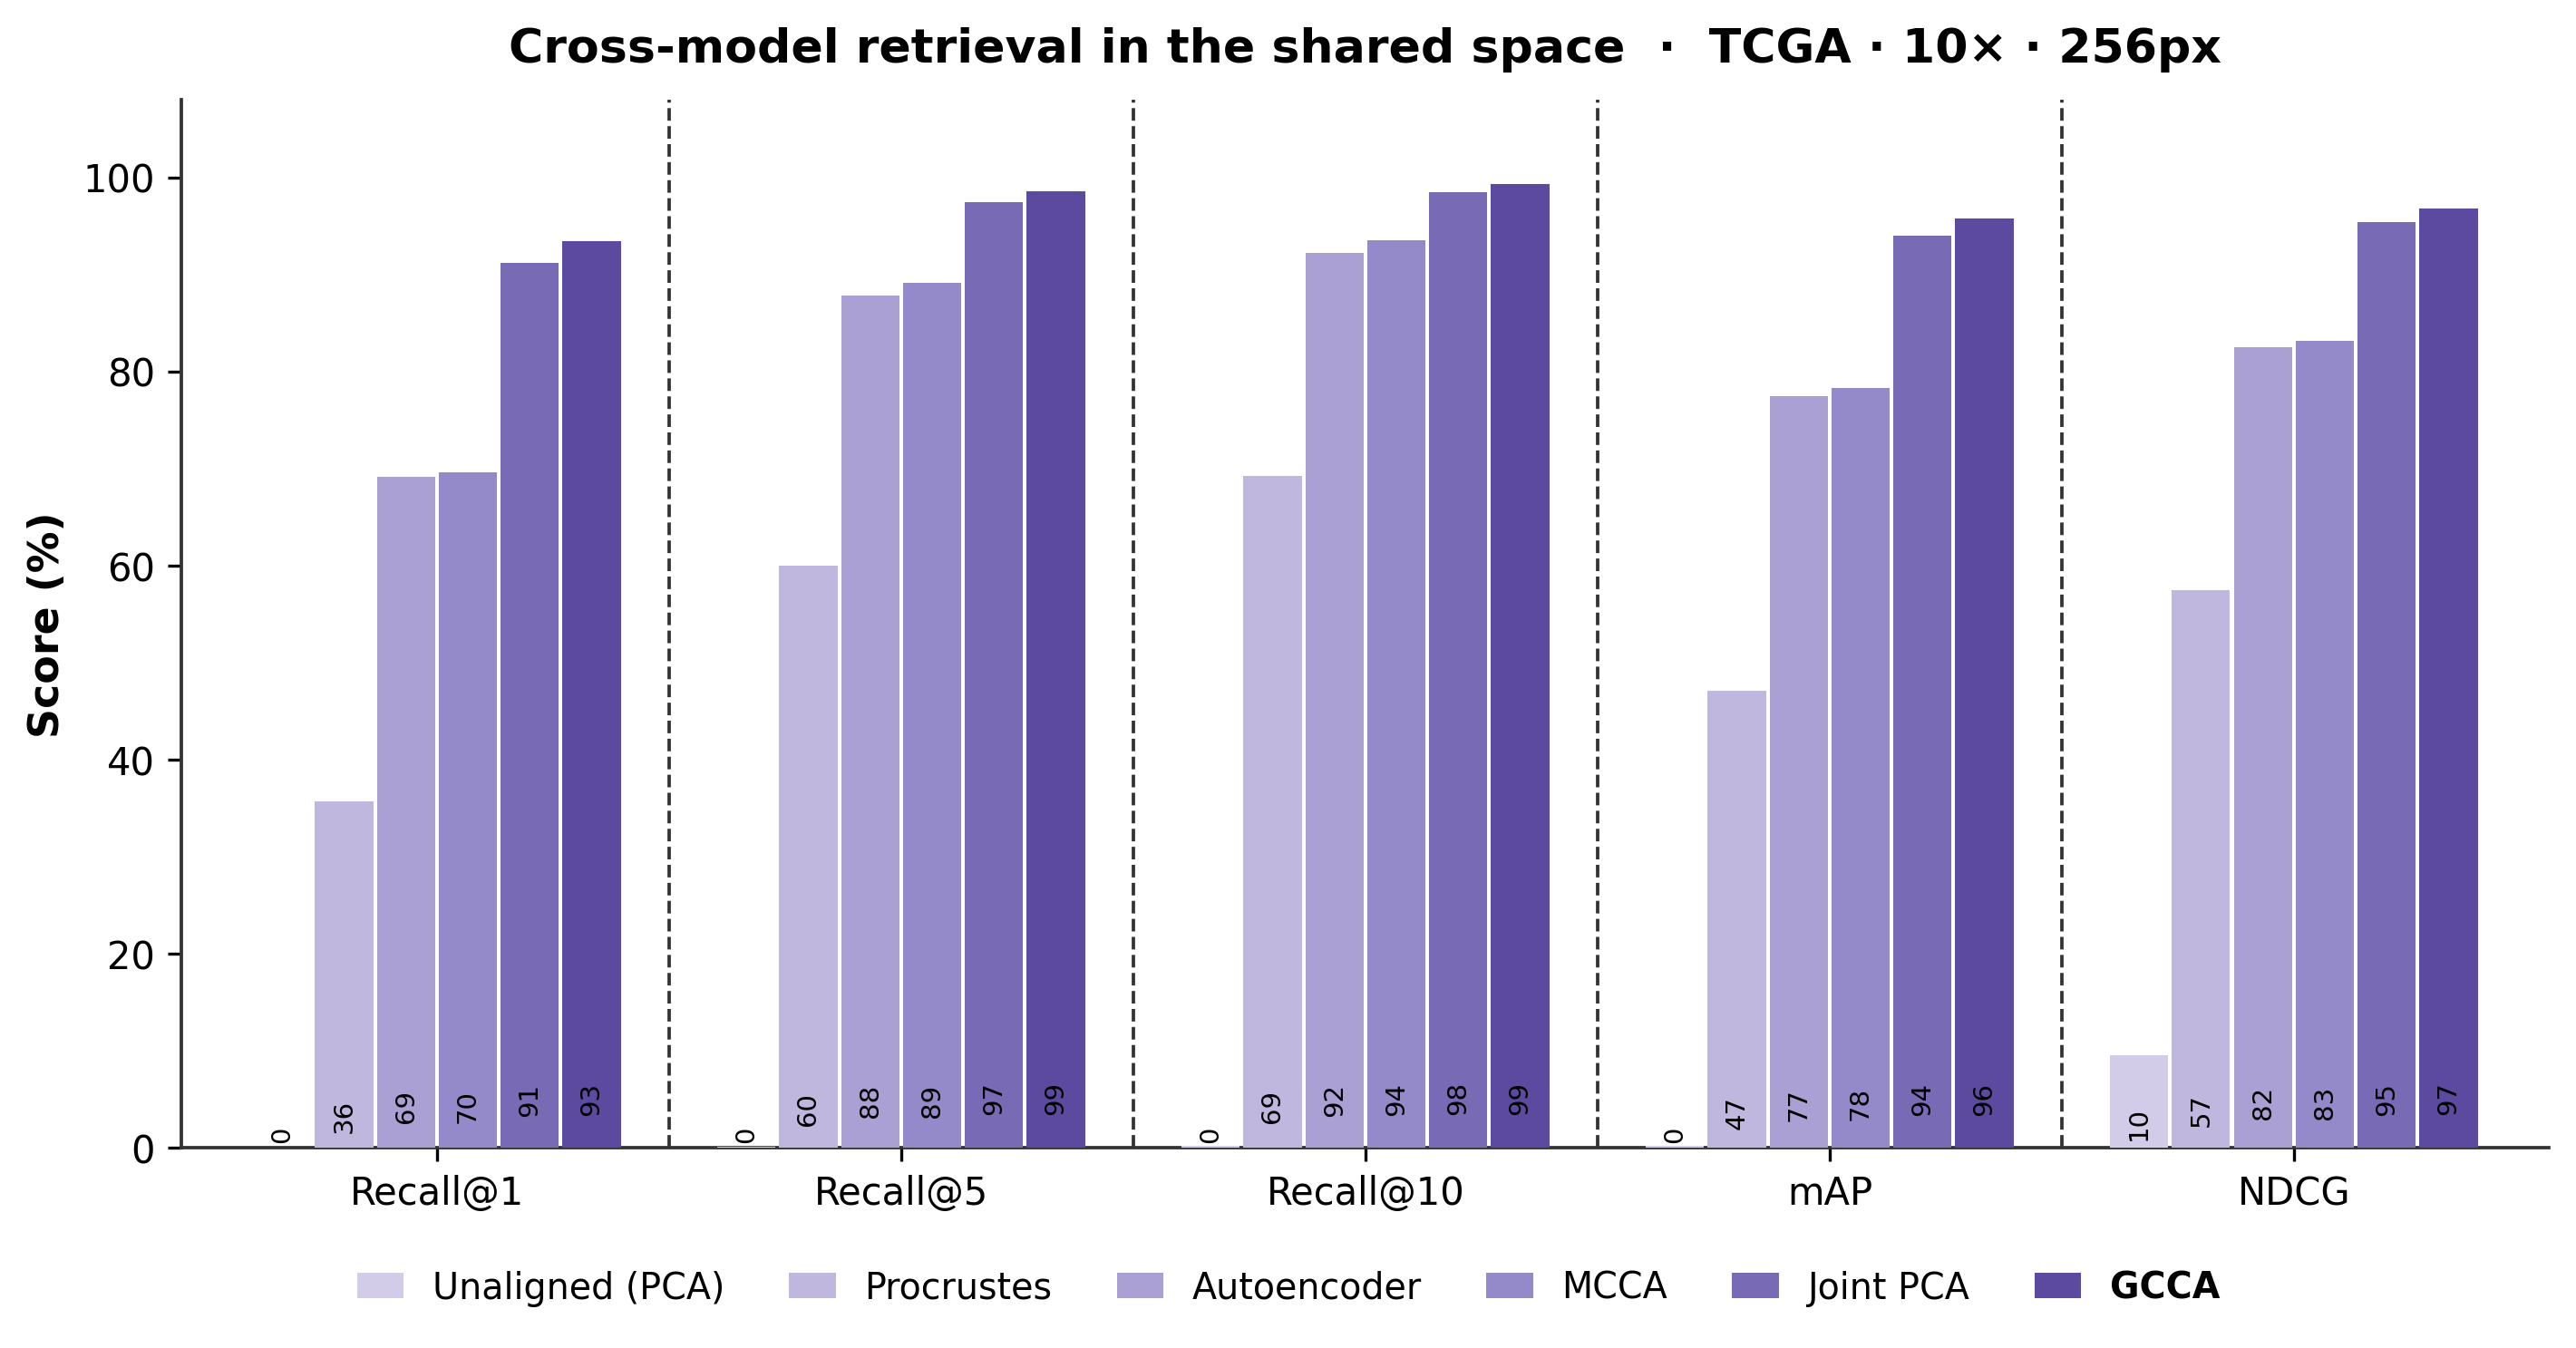
92.5–93.5% GCCA Recall@1 at 10× / 256px across CPTAC and TCGA
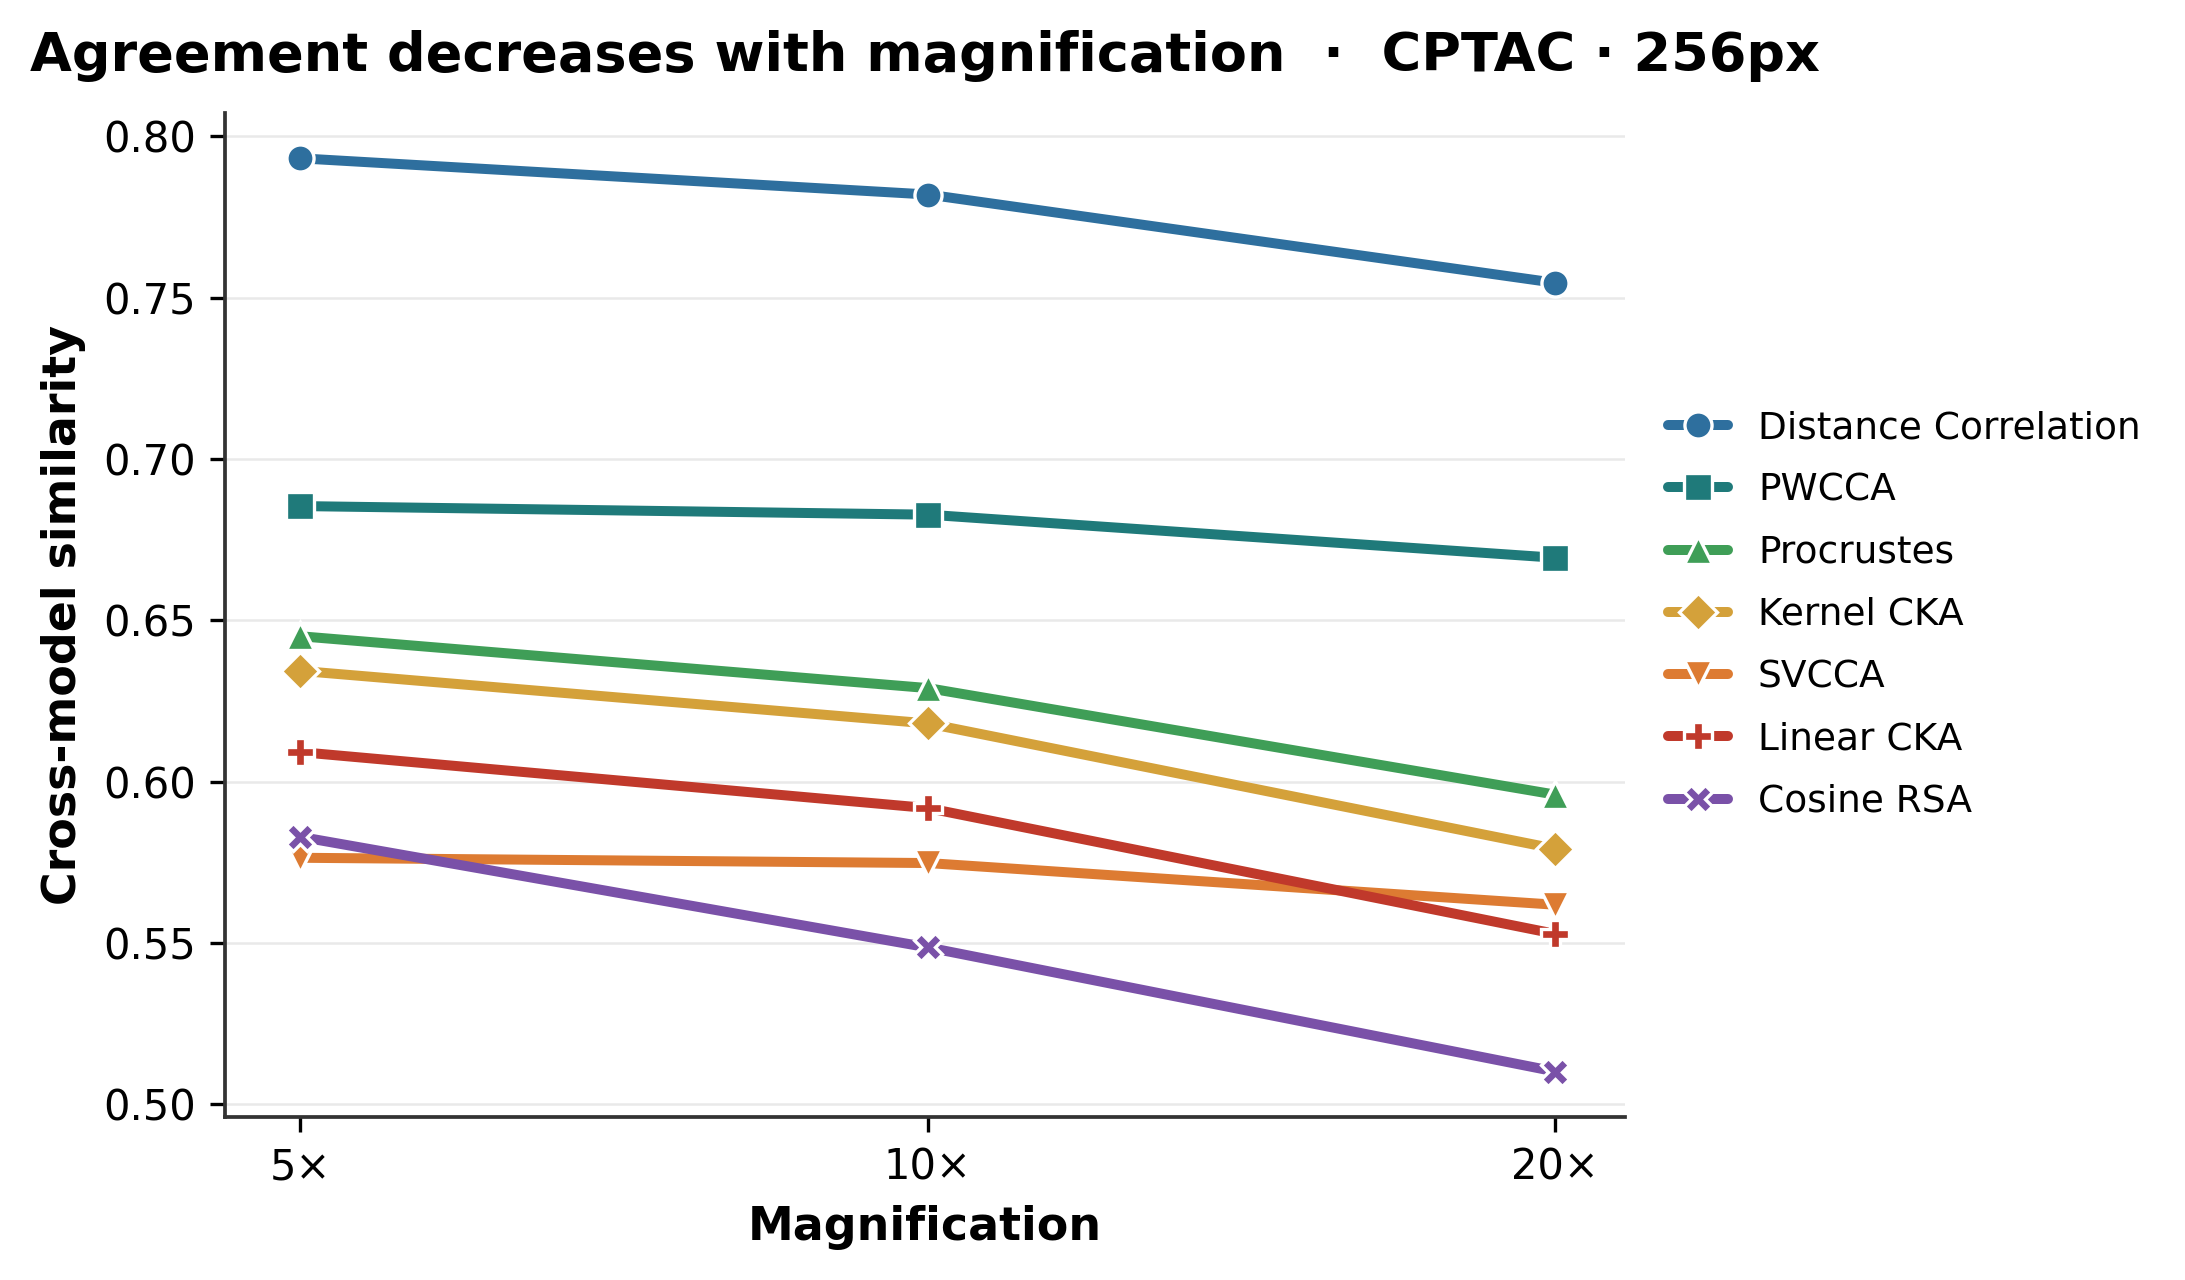
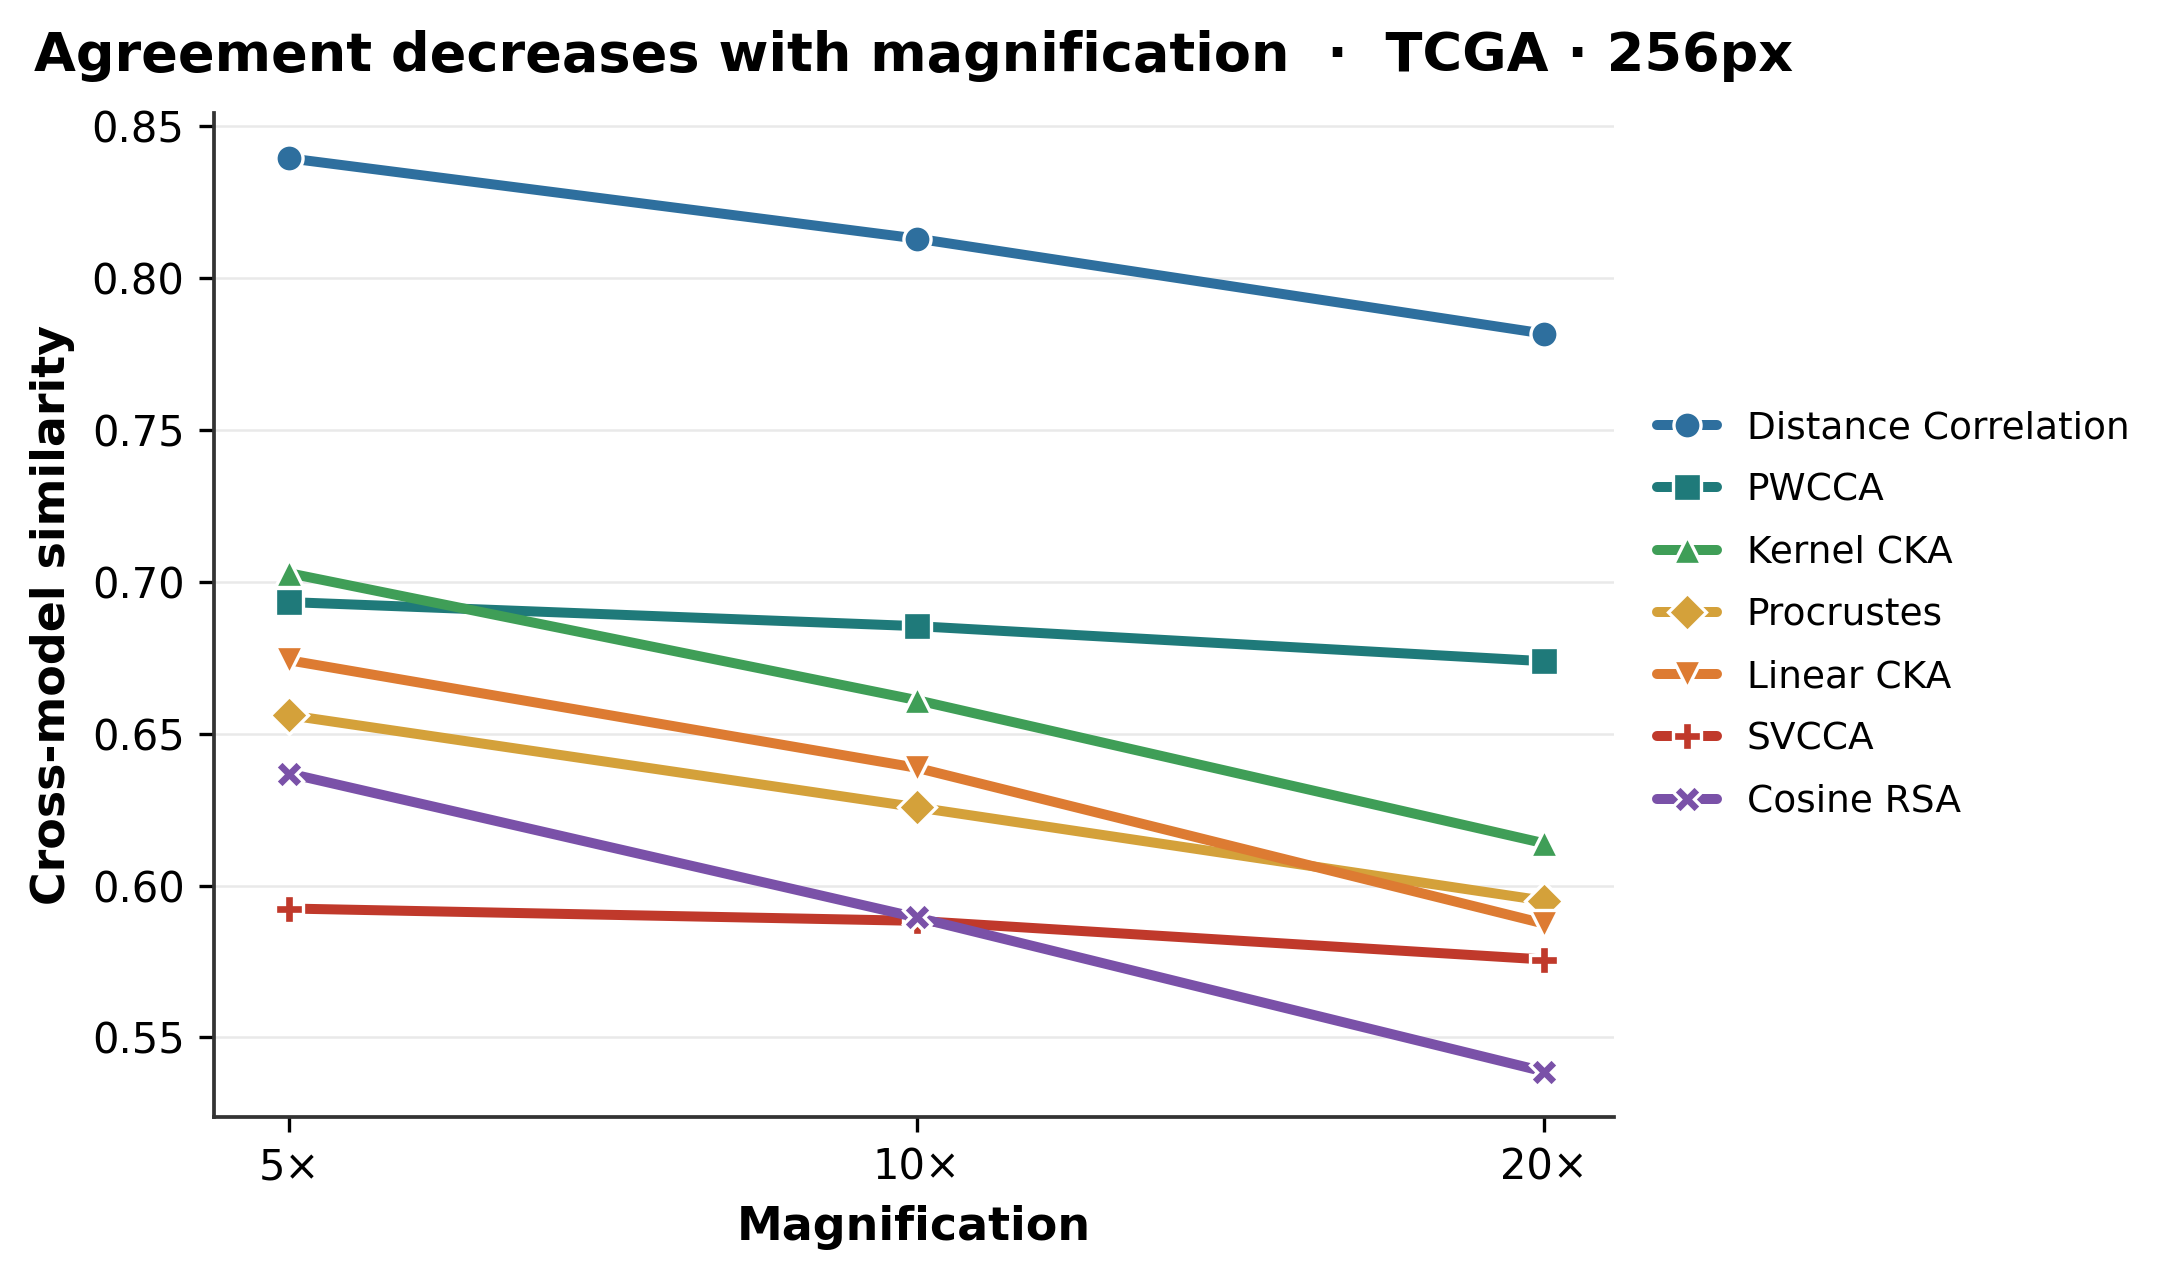
7 / 7 similarity measures decline from 5× to 20×
13 tasks compare best single, concatenated, and MOSAIC features
01

How similar are pathology encoder spaces?

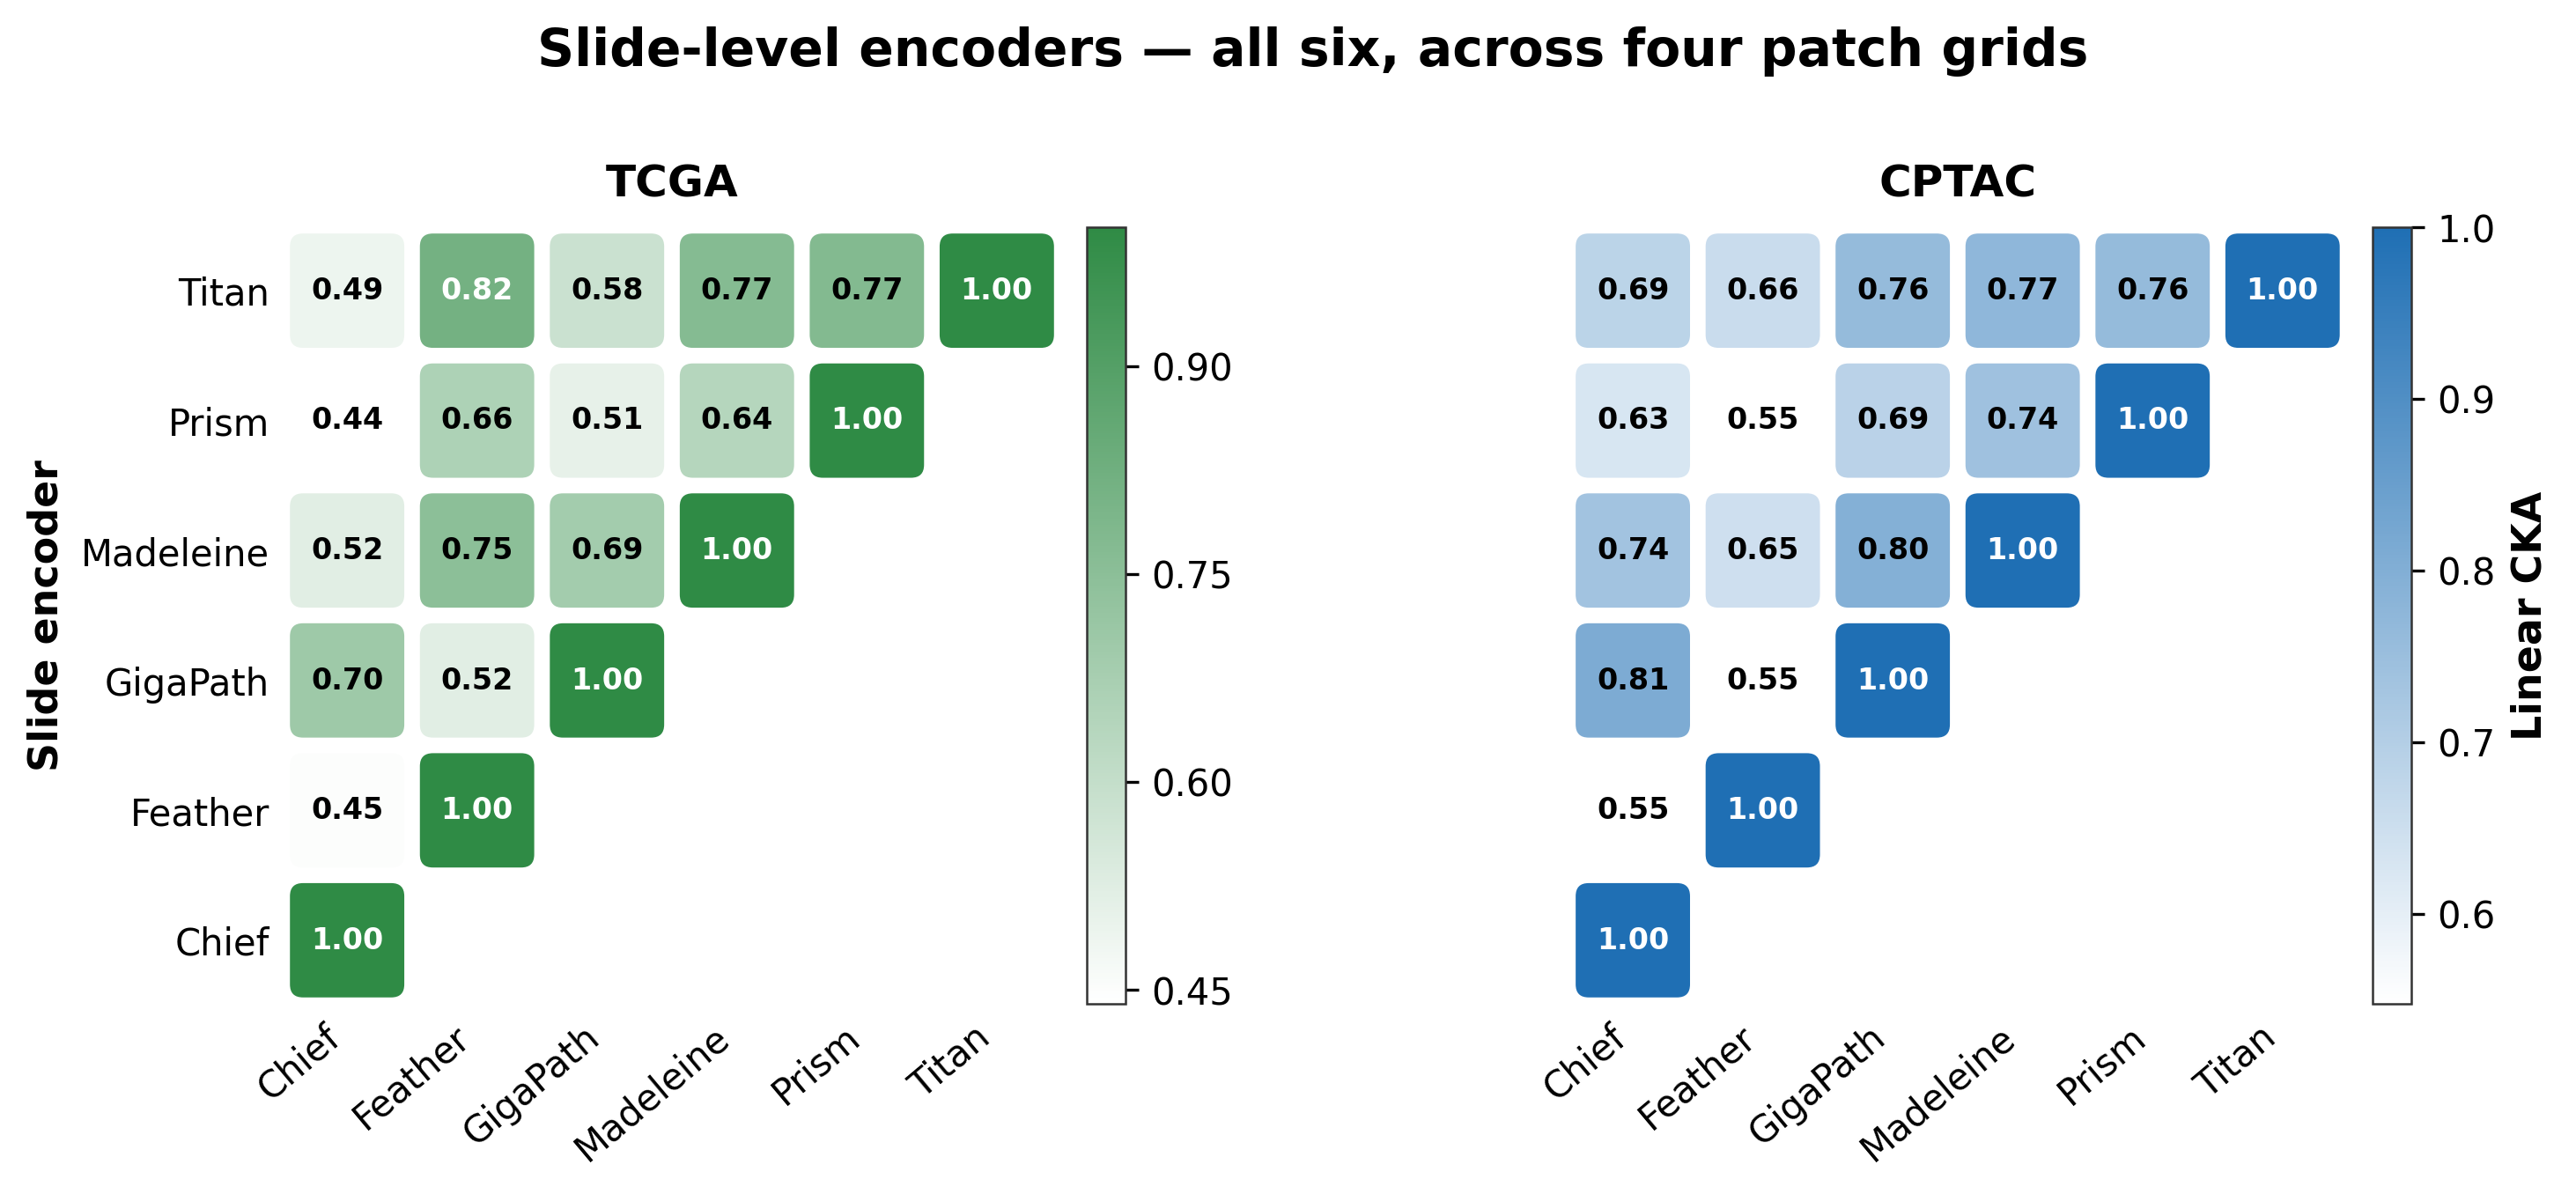
Patch encoders are compared only within matched coordinate grids; slide encoders can be compared directly across grids.
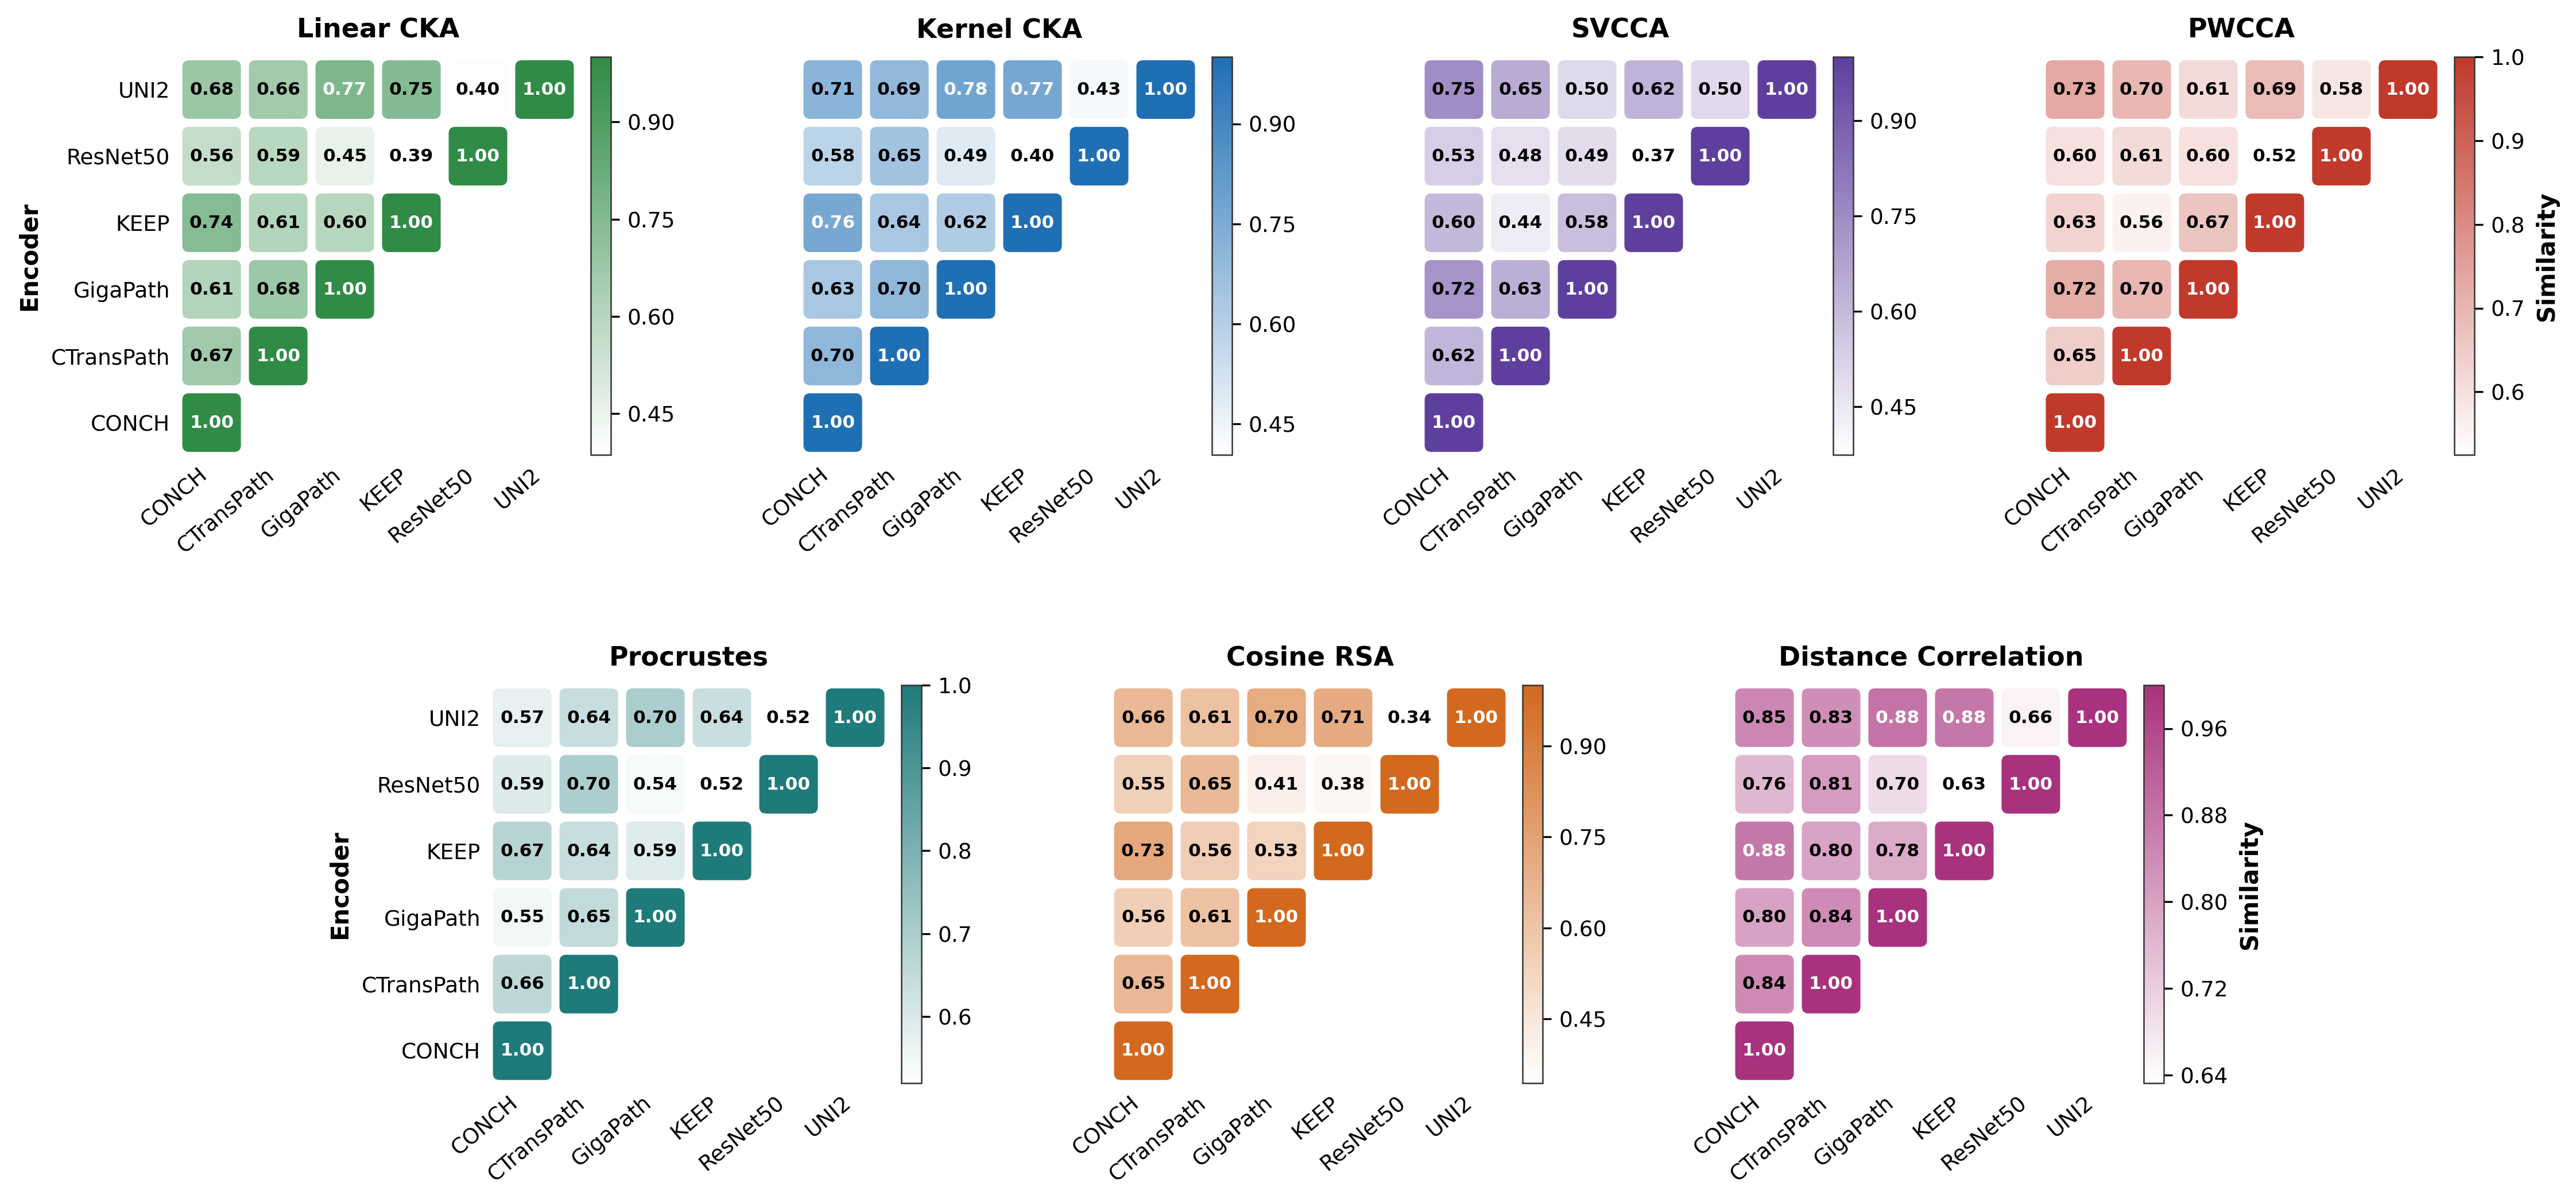
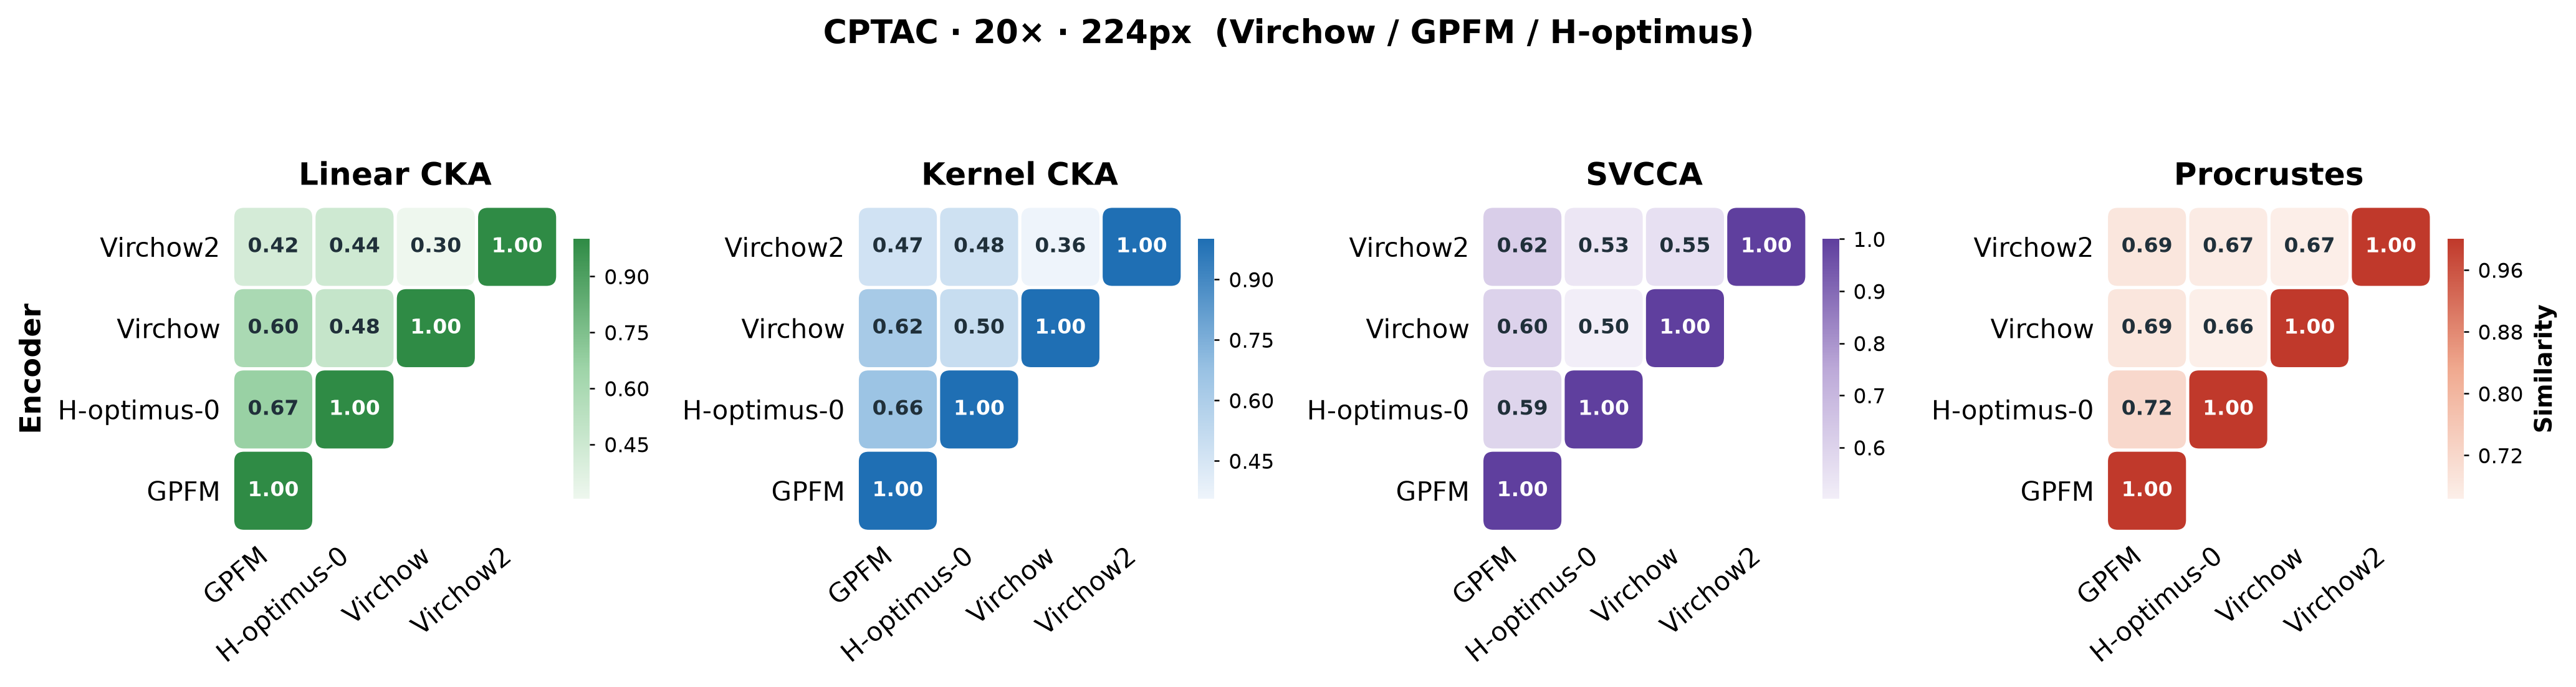
CPTAC · 10× · 256px · 6 encoders · 7 metricsOpen full resolution
Seven patch-encoder similarity matrices for the CPTAC 10x 256 pixel group
The shared morphology signal survives every similarity lens. ResNet50, the ImageNet-supervised control, is consistently least similar to the pathology encoders, while the seven metrics reveal complementary geometric relationships.